| Red | Green | Blue | |
| z | 17.64 | ||
| znorm | Inf | ||
| sky | -Inf | -Inf | -Inf |
| S/N | 35.4 | 61.9 | 66.3 |
| S/N(c) | 0.0 | 0.0 | 0.0 |
| SN(E/C) |

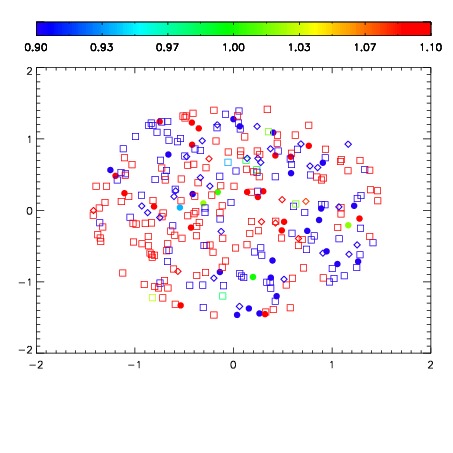


| Frame | Nreads | Zeropoints | Mag plots | Spatial mag deviation | Spatial sky 16325A emission deviations (filled: sky, open: star) | Spatial sky continuum emission | Spatial sky telluric CO2 absorption deviations (filled: H < 10) | |||||||||||||||||||||||
| 0 | 0 |
|
|
|
|
|
|
| IPAIR | NAME | SHIFT | NEWSHIFT | S/N | NAME | SHIFT | NEWSHIFT | S/N |
| 0 | 03640031 | 0.508881 | 0.00000 | 233.445 | 03640037 | -0.00539990 | 0.514281 | 235.109 |
| 1 | 03640039 | 0.499948 | 0.00893298 | 241.840 | 03640032 | 0.000265809 | 0.508615 | 238.167 |
| 2 | 03640035 | 0.499504 | 0.00937697 | 237.654 | 03640040 | -0.00264634 | 0.511527 | 238.155 |
| 3 | 03640030 | 0.506982 | 0.00189894 | 236.264 | 03640033 | -0.00511409 | 0.513995 | 236.366 |
| 4 | 03640034 | 0.499025 | 0.00985599 | 234.329 | 03640029 | 0.00000 | 0.508881 | 235.176 |
| 5 | 03640038 | 0.501126 | 0.00775498 | 232.406 | 03640036 | -0.00373615 | 0.512617 | 231.303 |