| Red | Green | Blue | |
| z | 17.64 | ||
| znorm | Inf | ||
| sky | -Inf | -Inf | -Inf |
| S/N | 35.8 | 59.8 | 64.2 |
| S/N(c) | 0.0 | 0.0 | 0.0 |
| SN(E/C) |
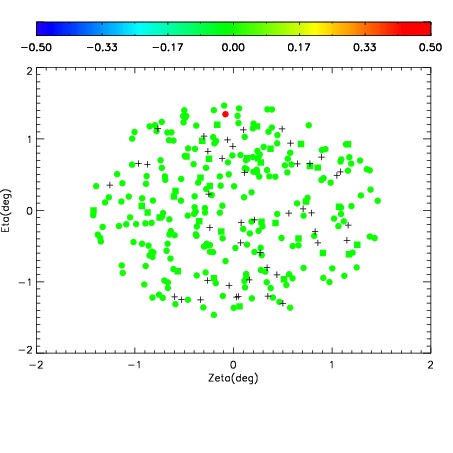
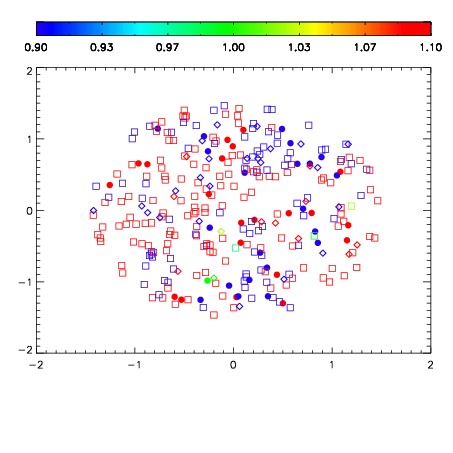
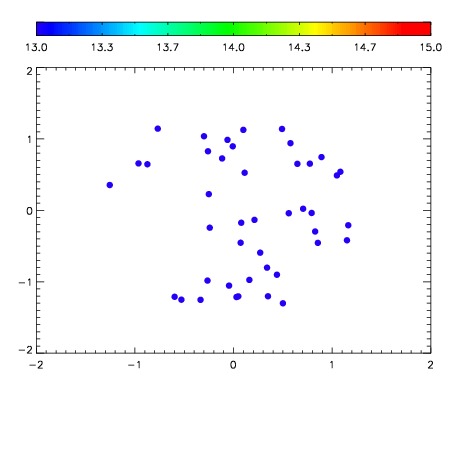

| Frame | Nreads | Zeropoints | Mag plots | Spatial mag deviation | Spatial sky 16325A emission deviations (filled: sky, open: star) | Spatial sky continuum emission | Spatial sky telluric CO2 absorption deviations (filled: H < 10) | |||||||||||||||||||||||
| 0 | 0 |
|
|
|
|
|
|
| IPAIR | NAME | SHIFT | NEWSHIFT | S/N | NAME | SHIFT | NEWSHIFT | S/N |
| 0 | 03650034 | 0.511041 | 0.00000 | 234.508 | 03650035 | 0.00319098 | 0.507850 | 237.206 |
| 1 | 03650037 | 0.507916 | 0.00312501 | 236.046 | 03650036 | -0.00146398 | 0.512505 | 239.689 |
| 2 | 03650038 | 0.509934 | 0.00110698 | 226.577 | 03650032 | 0.00000 | 0.511041 | 235.624 |
| 3 | 03650033 | 0.506746 | 0.00429499 | 225.419 | 03650039 | 0.00241134 | 0.508630 | 232.495 |
| 4 | 03650041 | 0.508193 | 0.00284797 | 220.310 | 03650040 | -0.00109660 | 0.512138 | 231.144 |
| 5 | 03650042 | 0.508976 | 0.00206500 | 207.451 | 03650043 | -0.000970956 | 0.512012 | 217.614 |