| Red | Green | Blue | |
| z | 17.64 | ||
| znorm | Inf | ||
| sky | -Inf | -Inf | -Inf |
| S/N | 27.6 | 47.8 | 52.2 |
| S/N(c) | 0.0 | 0.0 | 0.0 |
| SN(E/C) |
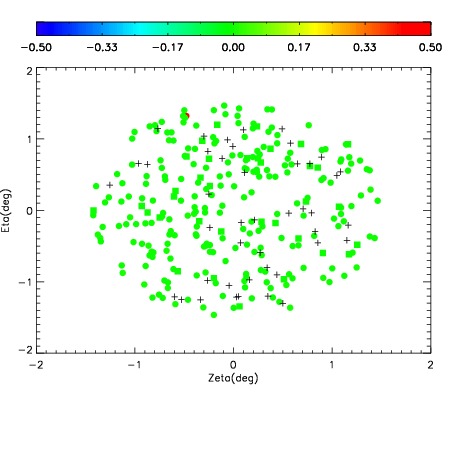
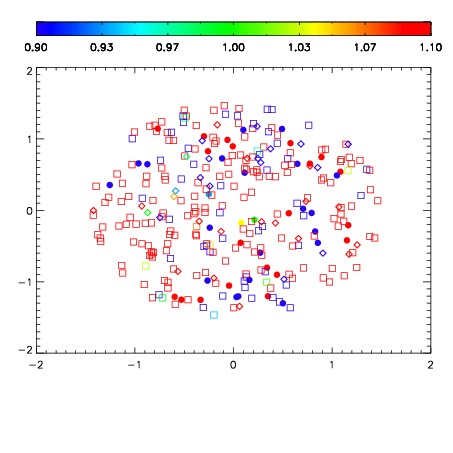
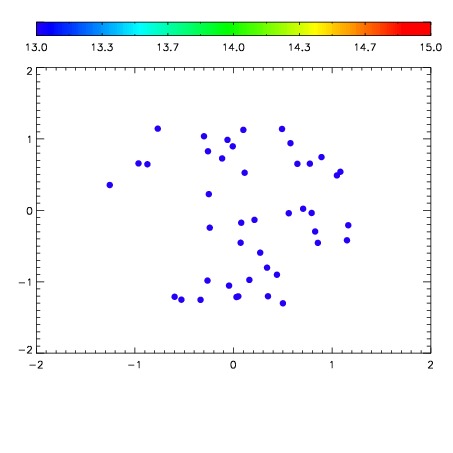

| Frame | Nreads | Zeropoints | Mag plots | Spatial mag deviation | Spatial sky 16325A emission deviations (filled: sky, open: star) | Spatial sky continuum emission | Spatial sky telluric CO2 absorption deviations (filled: H < 10) | |||||||||||||||||||||||
| 0 | 0 |
|
|
|
|
|
|
| IPAIR | NAME | SHIFT | NEWSHIFT | S/N | NAME | SHIFT | NEWSHIFT | S/N |
| 0 | 03690029 | 0.497963 | 0.00000 | 213.061 | 03690030 | 0.00267411 | 0.495289 | 219.359 |
| 1 | 03690024 | 0.495599 | 0.00236401 | 239.793 | 03690023 | 0.00000 | 0.497963 | 243.266 |
| 2 | 03690025 | 0.497876 | 8.70228e-05 | 229.004 | 03690027 | 0.00189934 | 0.496064 | 231.784 |
| 3 | 03690028 | 0.496477 | 0.00148600 | 222.409 | 03690026 | 0.00170313 | 0.496260 | 226.821 |