| Red | Green | Blue | |
| z | 17.64 | ||
| znorm | Inf | ||
| sky | -Inf | -Inf | -Inf |
| S/N | 30.7 | 49.6 | 51.9 |
| S/N(c) | 0.0 | 0.0 | 0.0 |
| SN(E/C) |
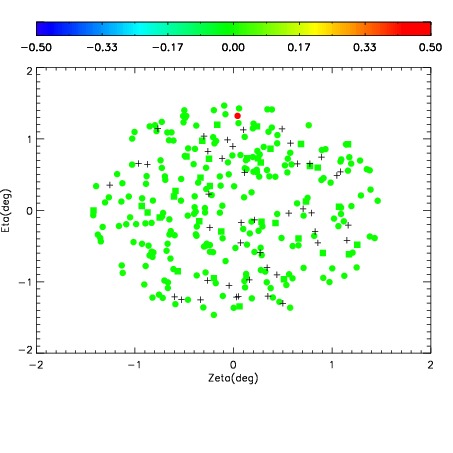
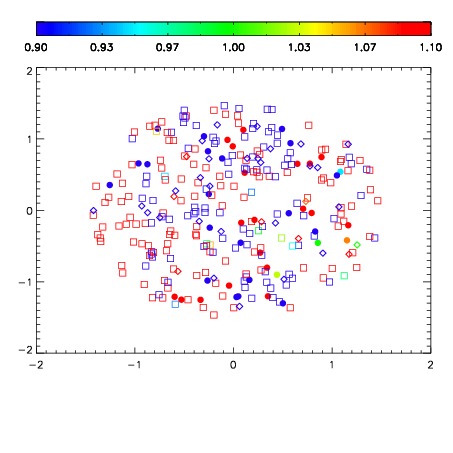
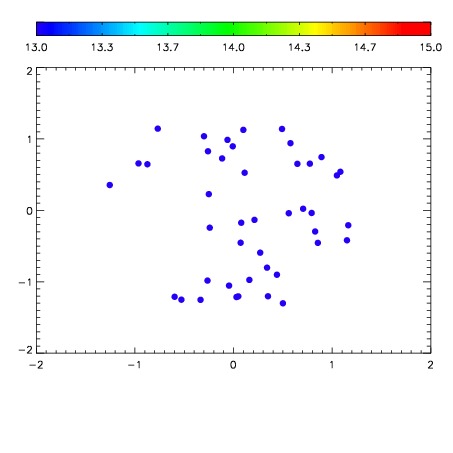

| Frame | Nreads | Zeropoints | Mag plots | Spatial mag deviation | Spatial sky 16325A emission deviations (filled: sky, open: star) | Spatial sky continuum emission | Spatial sky telluric CO2 absorption deviations (filled: H < 10) | |||||||||||||||||||||||
| 0 | 0 |
|
|
|
|
|
|
| IPAIR | NAME | SHIFT | NEWSHIFT | S/N | NAME | SHIFT | NEWSHIFT | S/N |
| 0 | 03940012 | 0.504465 | 0.00000 | 230.007 | 03940013 | 0.000484396 | 0.503981 | 224.068 |
| 1 | 03940011 | 0.503562 | 0.000903010 | 231.935 | 03940010 | 0.00000 | 0.504465 | 239.168 |
| 2 | 03940015 | 0.501839 | 0.00262600 | 222.770 | 03940014 | -0.000981471 | 0.505446 | 223.236 |
| 3 | 03940016 | 0.500974 | 0.00349098 | 221.115 | 03940017 | -0.000541263 | 0.505006 | 220.774 |