| Red | Green | Blue | |
| z | 17.64 | ||
| znorm | Inf | ||
| sky | -Inf | -Inf | -Inf |
| S/N | 28.3 | 47.2 | 51.5 |
| S/N(c) | 0.0 | 0.0 | 0.0 |
| SN(E/C) |
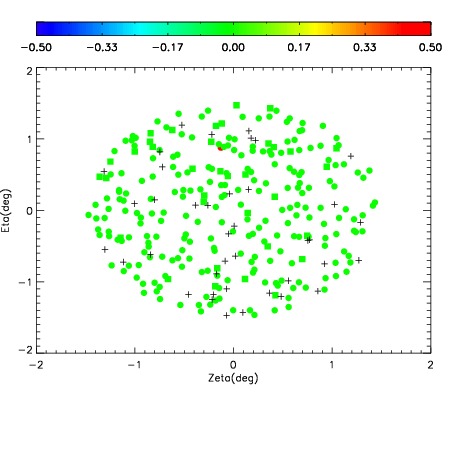
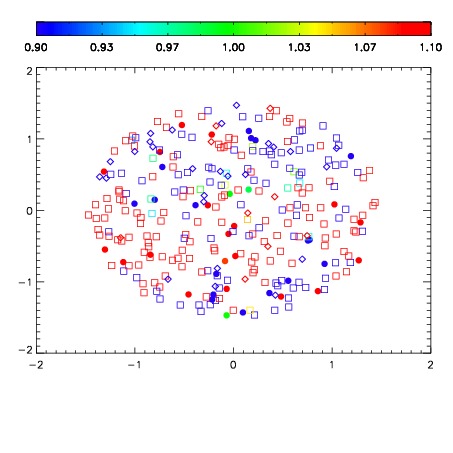
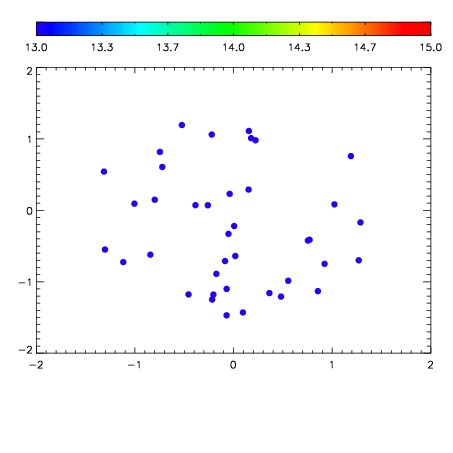

| Frame | Nreads | Zeropoints | Mag plots | Spatial mag deviation | Spatial sky 16325A emission deviations (filled: sky, open: star) | Spatial sky continuum emission | Spatial sky telluric CO2 absorption deviations (filled: H < 10) | |||||||||||||||||||||||
| 0 | 0 |
|
|
|
|
|
|
| IPAIR | NAME | SHIFT | NEWSHIFT | S/N | NAME | SHIFT | NEWSHIFT | S/N |
| 0 | 02870070 | 0.414417 | 0.00000 | 168.960 | 02870068 | -0.000338225 | 0.414755 | 166.338 |
| 1 | 02870069 | 0.413152 | 0.00126499 | 167.332 | 02870067 | 0.00160500 | 0.412812 | 164.348 |
| 2 | 02870066 | 0.413692 | 0.000725001 | 161.321 | 02870071 | 0.00193339 | 0.412484 | 161.748 |
| 3 | 02870065 | 0.412290 | 0.00212699 | 161.062 | 02870064 | 0.00000 | 0.414417 | 159.504 |