| Red | Green | Blue | |
| z | 17.64 | ||
| znorm | Inf | ||
| sky | -NaN | -NaN | -Inf |
| S/N | 30.7 | 55.7 | 59.8 |
| S/N(c) | 0.0 | 0.0 | 0.0 |
| SN(E/C) |
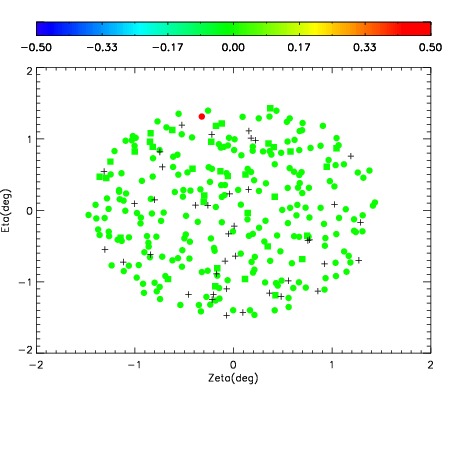
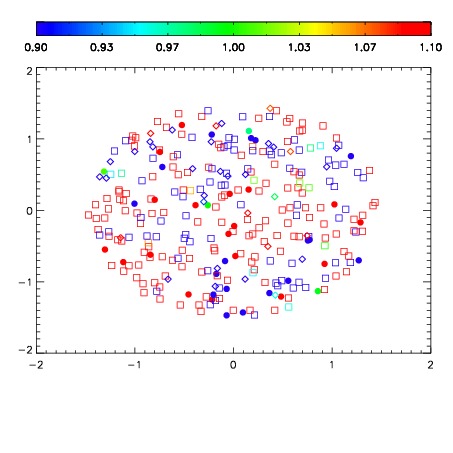
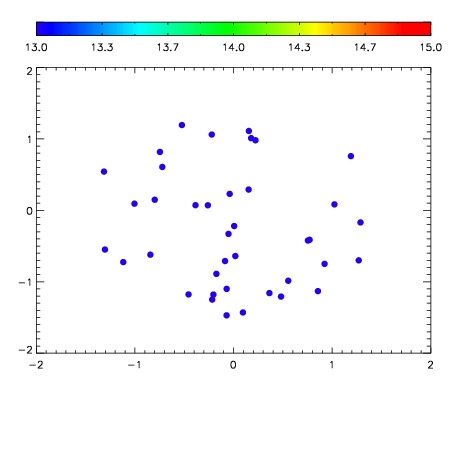

| Frame | Nreads | Zeropoints | Mag plots | Spatial mag deviation | Spatial sky 16325A emission deviations (filled: sky, open: star) | Spatial sky continuum emission | Spatial sky telluric CO2 absorption deviations (filled: H < 10) | |||||||||||||||||||||||
| 0 | 0 |
|
|
|
|
|
|
| IPAIR | NAME | SHIFT | NEWSHIFT | S/N | NAME | SHIFT | NEWSHIFT | S/N |
| 0 | 02910012 | 0.400956 | 0.00000 | 172.445 | 02910010 | 0.00000 | 0.400956 | 173.573 |
| 1 | 02910019 | 0.398321 | 0.00263500 | 189.220 | 02910017 | -3.39001e-05 | 0.400990 | 187.460 |
| 2 | 02910016 | 0.399639 | 0.00131699 | 184.226 | 02910018 | -0.00102562 | 0.401982 | 187.390 |
| 3 | 02910015 | 0.399435 | 0.00152099 | 180.256 | 02910014 | -0.000461790 | 0.401418 | 182.972 |
| 4 | 02910011 | 0.400201 | 0.000755012 | 174.511 | 02910013 | 0.000779830 | 0.400176 | 176.282 |