| Red | Green | Blue | |
| z | 17.64 | ||
| znorm | Inf | ||
| sky | -Inf | -Inf | -Inf |
| S/N | 27.6 | 48.3 | 53.6 |
| S/N(c) | 0.0 | 0.0 | 0.0 |
| SN(E/C) |
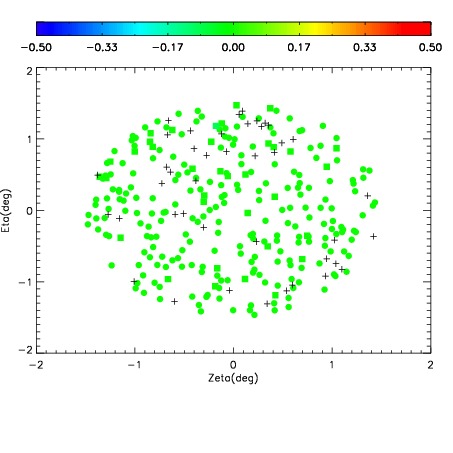
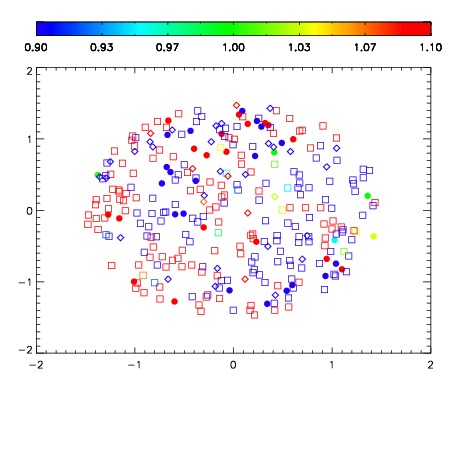
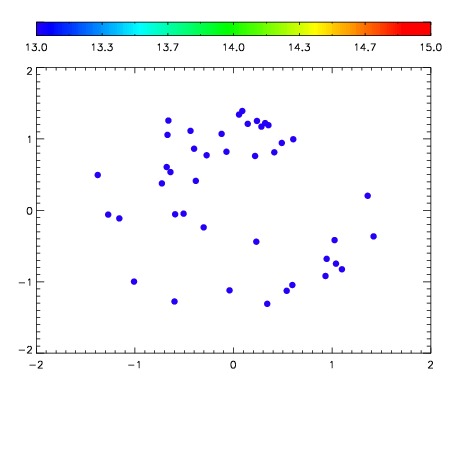

| Frame | Nreads | Zeropoints | Mag plots | Spatial mag deviation | Spatial sky 16325A emission deviations (filled: sky, open: star) | Spatial sky continuum emission | Spatial sky telluric CO2 absorption deviations (filled: H < 10) | |||||||||||||||||||||||
| 0 | 0 |
|
|
|
|
|
|
| IPAIR | NAME | SHIFT | NEWSHIFT | S/N | NAME | SHIFT | NEWSHIFT | S/N |
| 0 | 02860066 | 0.412813 | 0.00000 | 212.276 | 02860067 | 0.000671486 | 0.412142 | 210.693 |
| 1 | 02860070 | 0.410850 | 0.00196302 | 208.645 | 02860068 | -0.00108689 | 0.413900 | 207.608 |
| 2 | 02860069 | 0.409378 | 0.00343502 | 208.487 | 02860071 | 0.00217873 | 0.410634 | 207.426 |
| 3 | 02860065 | 0.411186 | 0.00162700 | 207.299 | 02860064 | 0.00000 | 0.412813 | 204.692 |