| Red | Green | Blue | |
| z | 17.64 | ||
| znorm | Inf | ||
| sky | -Inf | -Inf | -Inf |
| S/N | 29.7 | 51.1 | 55.7 |
| S/N(c) | 0.0 | 0.0 | 0.0 |
| SN(E/C) |
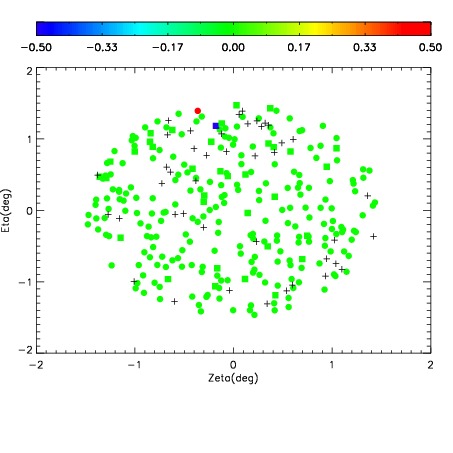
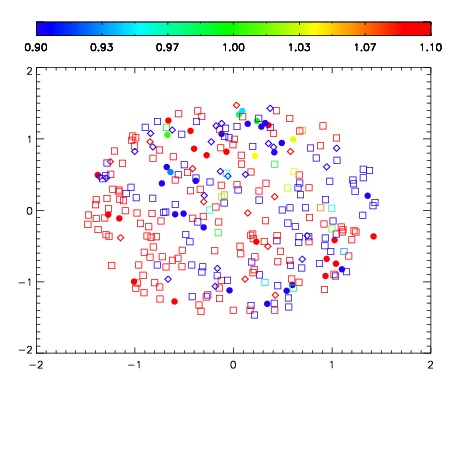
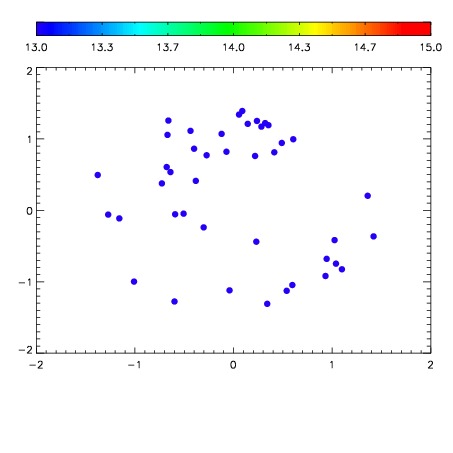

| Frame | Nreads | Zeropoints | Mag plots | Spatial mag deviation | Spatial sky 16325A emission deviations (filled: sky, open: star) | Spatial sky continuum emission | Spatial sky telluric CO2 absorption deviations (filled: H < 10) | |||||||||||||||||||||||
| 0 | 0 |
|
|
|
|
|
|
| IPAIR | NAME | SHIFT | NEWSHIFT | S/N | NAME | SHIFT | NEWSHIFT | S/N |
| 0 | 03970019 | 0.502637 | 0.00000 | 181.453 | 03970018 | 0.00288194 | 0.499755 | 174.723 |
| 1 | 03970012 | 0.501777 | 0.000860035 | 199.645 | 03970010 | 0.00000 | 0.502637 | 210.133 |
| 2 | 03970016 | 0.501355 | 0.00128204 | 196.868 | 03970017 | 0.00240432 | 0.500233 | 192.259 |
| 3 | 03970011 | 0.501579 | 0.00105804 | 191.968 | 03970013 | 4.33053e-05 | 0.502594 | 188.109 |
| 4 | 03970015 | 0.501265 | 0.00137204 | 184.913 | 03970014 | 0.00122426 | 0.501413 | 180.597 |