| Red | Green | Blue | |
| z | 17.64 | ||
| znorm | Inf | ||
| sky | -Inf | -Inf | -Inf |
| S/N | 24.8 | 43.6 | 49.3 |
| S/N(c) | 0.0 | 0.0 | 0.0 |
| SN(E/C) |
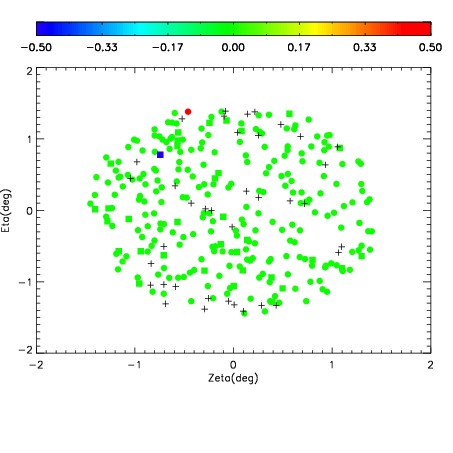

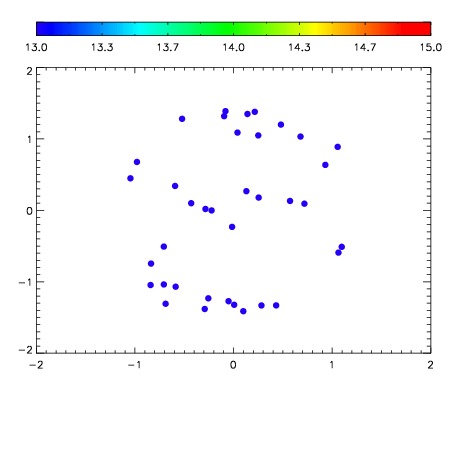

| Frame | Nreads | Zeropoints | Mag plots | Spatial mag deviation | Spatial sky 16325A emission deviations (filled: sky, open: star) | Spatial sky continuum emission | Spatial sky telluric CO2 absorption deviations (filled: H < 10) | |||||||||||||||||||||||
| 0 | 0 |
|
|
|
|
|
|
| IPAIR | NAME | SHIFT | NEWSHIFT | S/N | NAME | SHIFT | NEWSHIFT | S/N |
| 0 | 02620068 | 0.426958 | 0.00000 | 65.7842 | 02620066 | 0.00000 | 0.426958 | 137.666 |
| 1 | 02620071 | 0.421377 | 0.00558099 | 221.075 | 02620073 | 0.00145085 | 0.425507 | 205.768 |
| 2 | 02620072 | 0.426145 | 0.000813007 | 203.955 | 02620070 | -0.00100662 | 0.427965 | 205.395 |
| 3 | 02620075 | 0.420325 | 0.00663298 | 202.296 | 02620074 | -0.000124783 | 0.427083 | 201.596 |
| 4 | 02620067 | 0.420186 | 0.00677198 | 145.555 | 02620069 | 0.000745961 | 0.426212 | 194.415 |