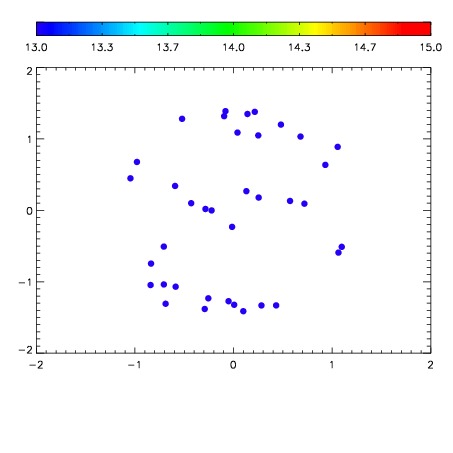
| Frame | Nreads | Zeropoints | Mag plots
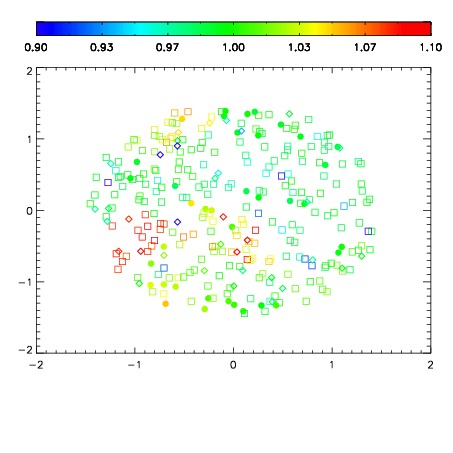
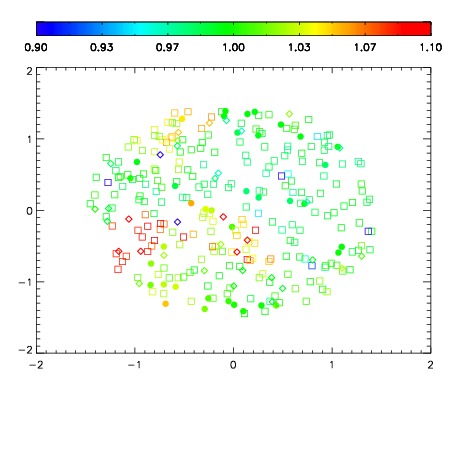
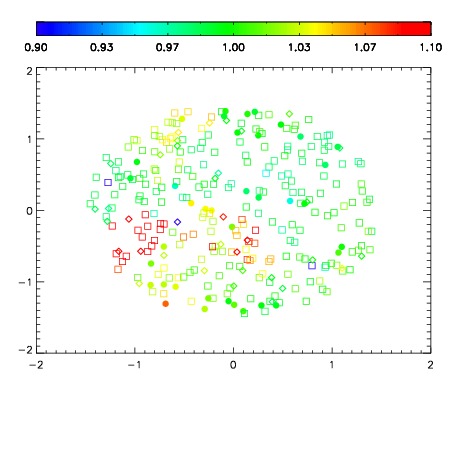
| Spatial mag deviation
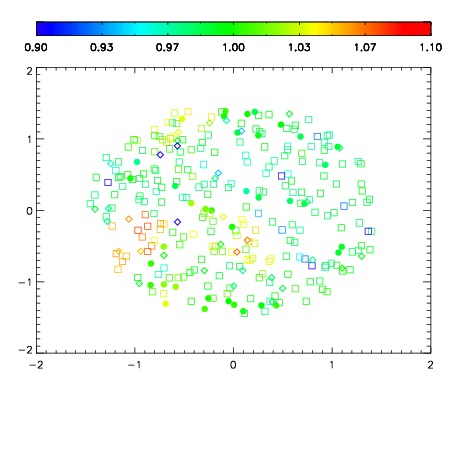
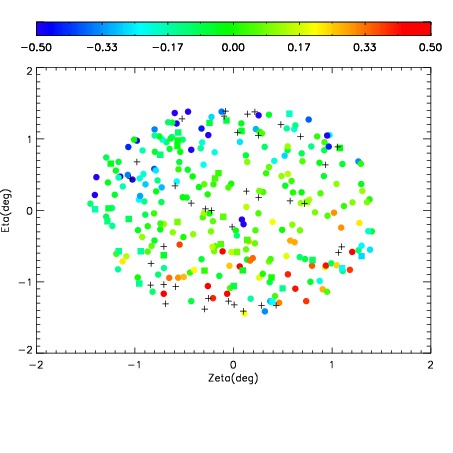
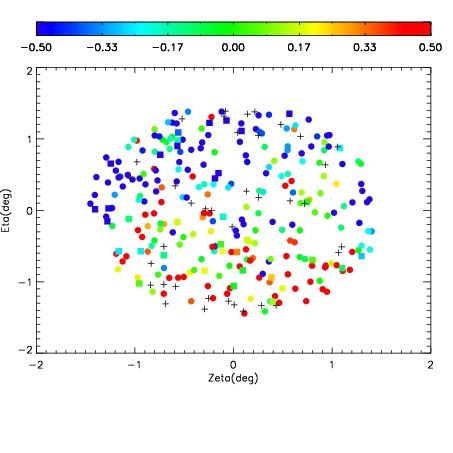
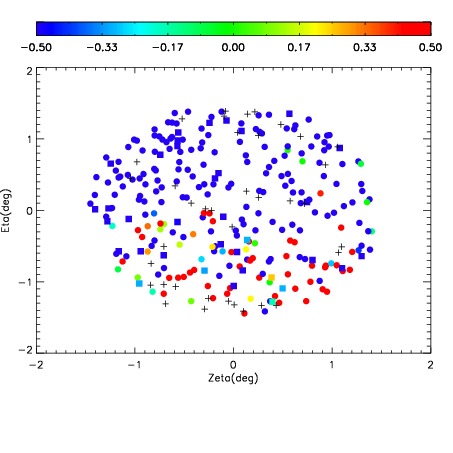
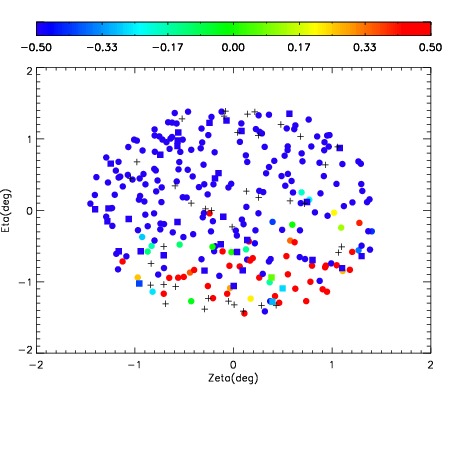
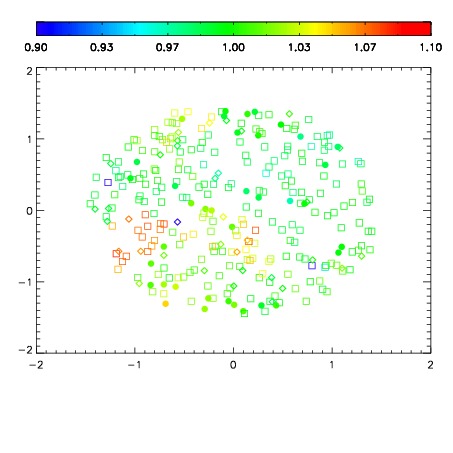
| Spatial sky 16325A emission deviations (filled: sky, open: star)
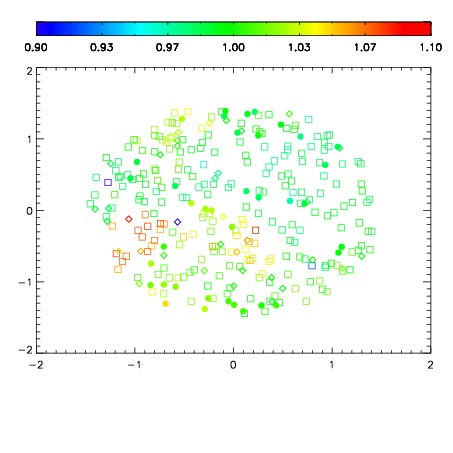
| Spatial sky continuum emission
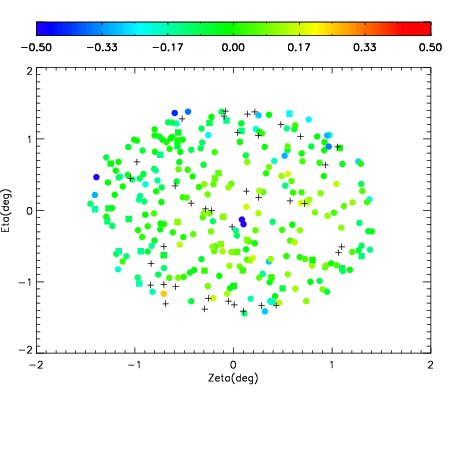
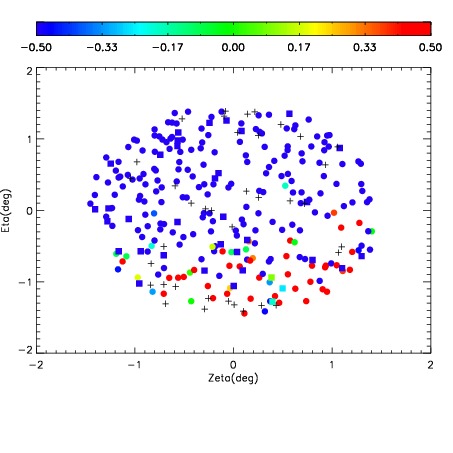
| Spatial sky telluric CO2 absorption deviations (filled: H < 10)
|
| 3150023
| 47
| | Red | Green | Blue
| | z | | 17.94
| | znorm | | 13.76
| | sky | 12.6 | 12.5 | 12.4
| | S/N | 5.8 | 9.4 | 9.3
| | S/N(c) | 5.1 | 8.6 | 9.6
| | SN(E/C) 1.00
|
| 
| 
| 
| 
| 
|
| 3150024
| 47
| | Red | Green | Blue
| | z | | 18.21
| | znorm | | 14.03
| | sky | 12.9 | 12.8 | 12.7
| | S/N | 7.4 | 12.5 | 12.8
| | S/N(c) | 6.6 | 11.5 | 12.5
| | SN(E/C) 0.94
|
| 
| 
| 
| 
| 
|
| 3150025
| 47
| | Red | Green | Blue
| | z | | 17.51
| | znorm | | 13.33
| | sky | 12.2 | 12.1 | 12.1
| | S/N | 3.8 | 6.3 | 5.1
| | S/N(c) | 3.1 | 5.5 | 6.4
| | SN(E/C) 1.02
|
| 
| 
| 
| 
| 
|
| 3150026
| 47
| | Red | Green | Blue
| | z | | 17.44
| | znorm | | 13.26
| | sky | 12.3 | 12.3 | 12.3
| | S/N | 3.7 | 6.4 | 4.9
| | S/N(c) | 2.9 | 5.4 | 6.6
| | SN(E/C) 0.98
|
| 
| 
| 
| 
| 
|
| 3150027
| 47
| | Red | Green | Blue
| | z | | 14.57
| | znorm | | 10.39
| | sky | 12.3 | 12.3 | 12.5
| | S/N | 0.1 | 0.5 | -0.2
| | S/N(c) | 0.0 | 0.0 | 0.0
| | SN(E/C) 4.68
|
| 
| 
| 
| 
| 
|
| 3150028
| 47
| | Red | Green | Blue
| | z | | 13.81
| | znorm | | 9.63
| | sky | 12.6 | 12.7 | 13.0
| | S/N | -0.2 | -0.2 | -0.7
| | S/N(c) | 0.0 | 0.0 | 0.0
| | SN(E/C)10.79
|
| 
| 
| 
| 
| 
|
| 3150029
| 47
| | Red | Green | Blue
| | z | | 14.66
| | znorm | | 10.48
| | sky | 12.1 | 12.1 | 12.3
| | S/N | -0.1 | -0.2 | -1.7
| | S/N(c) | 0.0 | 0.0 | 0.0
| | SN(E/C) 7.75
|
| 
| 
| 
| 
| 
|
| 3150030
| 47
| | Red | Green | Blue
| | z | | 14.57
| | znorm | | 10.39
| | sky | 12.2 | 12.2 | 12.3
| | S/N | -0.1 | -0.3 | -1.6
| | S/N(c) | 0.0 | 0.0 | 0.0
| | SN(E/C) 8.18
|
| 
| 
| 
| 
| 
|