| Red | Green | Blue | |
| z | 17.64 | ||
| znorm | Inf | ||
| sky | -NaN | -Inf | -Inf |
| S/N | 25.7 | 46.6 | 50.6 |
| S/N(c) | 0.0 | 0.0 | 0.0 |
| SN(E/C) |
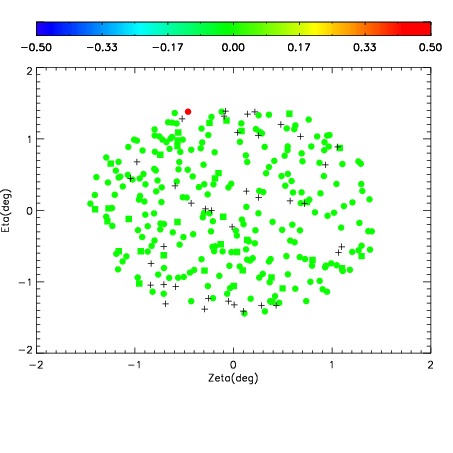
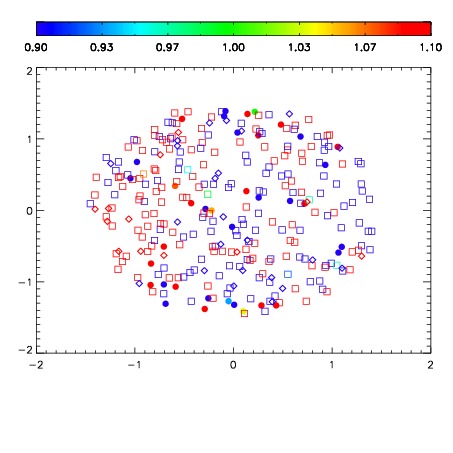


| Frame | Nreads | Zeropoints | Mag plots | Spatial mag deviation | Spatial sky 16325A emission deviations (filled: sky, open: star) | Spatial sky continuum emission | Spatial sky telluric CO2 absorption deviations (filled: H < 10) | |||||||||||||||||||||||
| 0 | 0 |
|
|
|
|
|
|
| IPAIR | NAME | SHIFT | NEWSHIFT | S/N | NAME | SHIFT | NEWSHIFT | S/N |
| 0 | 03210035 | 0.504590 | 0.00000 | 203.220 | 03210033 | 0.000325558 | 0.504264 | 199.664 |
| 1 | 03210030 | 0.501675 | 0.00291497 | 208.669 | 03210036 | 0.00121512 | 0.503375 | 206.379 |
| 2 | 03210034 | 0.501250 | 0.00333995 | 204.157 | 03210032 | 0.00191961 | 0.502670 | 204.131 |
| 3 | 03210031 | 0.503606 | 0.000983953 | 188.130 | 03210029 | 0.00000 | 0.504590 | 187.764 |