| Red | Green | Blue | |
| z | 17.64 | ||
| znorm | Inf | ||
| sky | -Inf | -Inf | -Inf |
| S/N | 19.1 | 32.1 | 35.1 |
| S/N(c) | 0.0 | 0.0 | 0.0 |
| SN(E/C) |
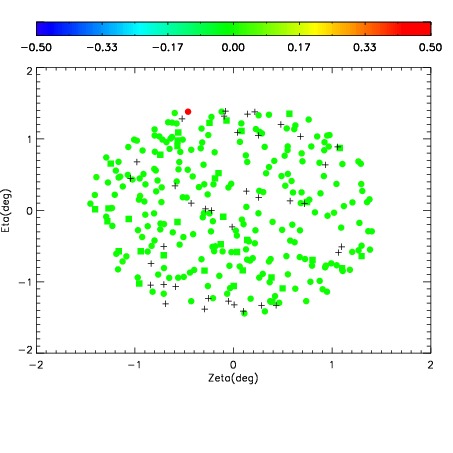
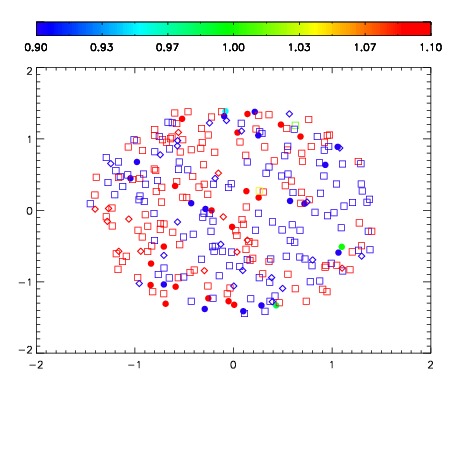
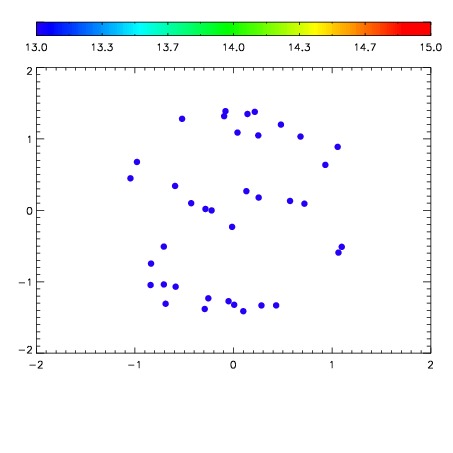

| Frame | Nreads | Zeropoints | Mag plots | Spatial mag deviation | Spatial sky 16325A emission deviations (filled: sky, open: star) | Spatial sky continuum emission | Spatial sky telluric CO2 absorption deviations (filled: H < 10) | |||||||||||||||||||||||
| 0 | 0 |
|
|
|
|
|
|
| IPAIR | NAME | SHIFT | NEWSHIFT | S/N | NAME | SHIFT | NEWSHIFT | S/N |
| 0 | 03420031 | 0.496475 | 0.00000 | 154.846 | 03420032 | 0.00275334 | 0.493722 | 164.749 |
| 1 | 03420026 | 0.491912 | 0.00456300 | 196.846 | 03420025 | 0.00000 | 0.496475 | 188.375 |
| 2 | 03420027 | 0.494048 | 0.00242701 | 184.279 | 03420029 | 0.000349124 | 0.496126 | 173.804 |
| 3 | 03420030 | 0.493891 | 0.00258401 | 173.490 | 03420028 | 0.00107546 | 0.495400 | 165.375 |