| Red | Green | Blue | |
| z | 17.64 | ||
| znorm | Inf | ||
| sky | -Inf | -Inf | -Inf |
| S/N | 29.0 | 50.8 | 55.2 |
| S/N(c) | 0.0 | 0.0 | 0.0 |
| SN(E/C) |
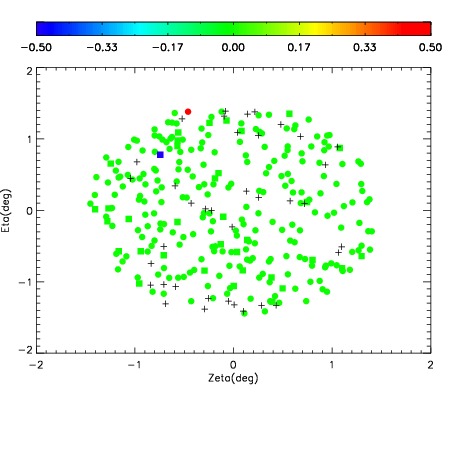

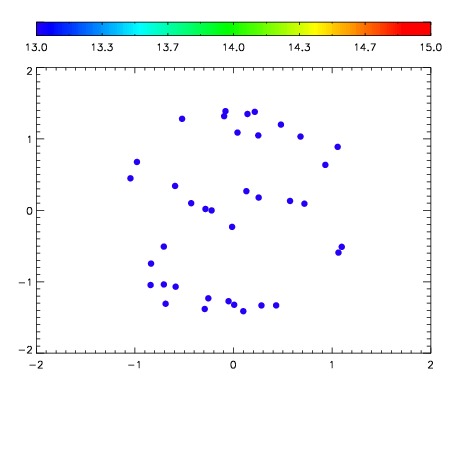

| Frame | Nreads | Zeropoints | Mag plots | Spatial mag deviation | Spatial sky 16325A emission deviations (filled: sky, open: star) | Spatial sky continuum emission | Spatial sky telluric CO2 absorption deviations (filled: H < 10) | |||||||||||||||||||||||
| 0 | 0 |
|
|
|
|
|
|
| IPAIR | NAME | SHIFT | NEWSHIFT | S/N | NAME | SHIFT | NEWSHIFT | S/N |
| 0 | 03430051 | 0.503194 | 0.00000 | 217.885 | 03430049 | -0.000931924 | 0.504126 | 220.223 |
| 1 | 03430047 | 0.502496 | 0.000697970 | 226.378 | 03430045 | 0.00000 | 0.503194 | 232.017 |
| 2 | 03430046 | 0.501748 | 0.00144595 | 224.034 | 03430048 | -0.000338271 | 0.503532 | 222.058 |
| 3 | 03430050 | 0.501419 | 0.00177497 | 217.624 | 03430052 | -0.000510151 | 0.503704 | 203.876 |