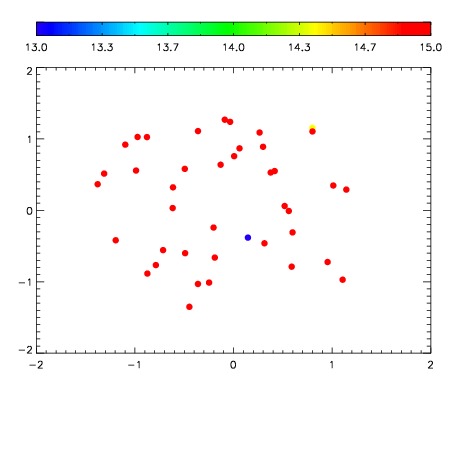
| Frame | Nreads | Zeropoints | Mag plots
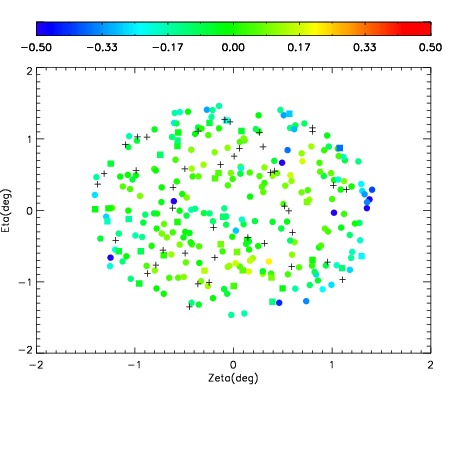
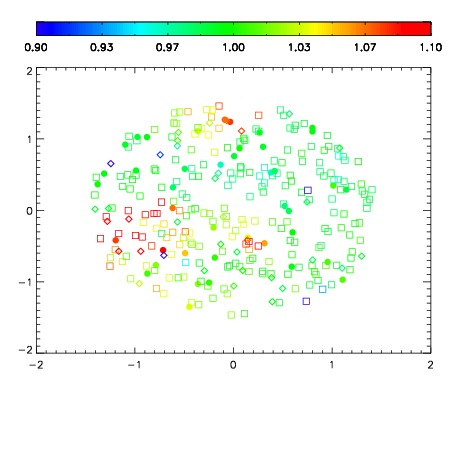
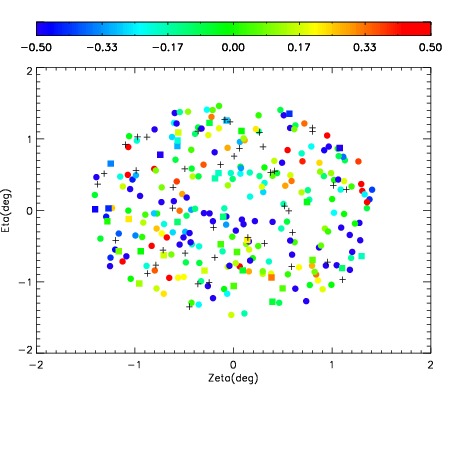
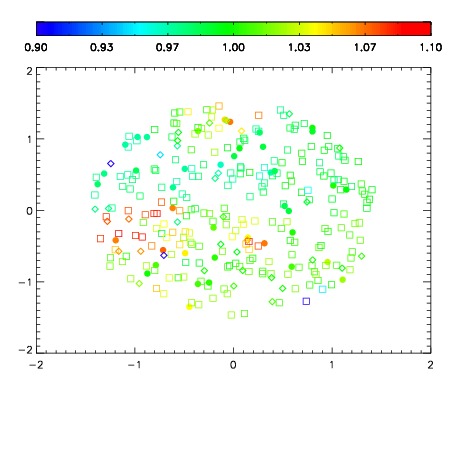
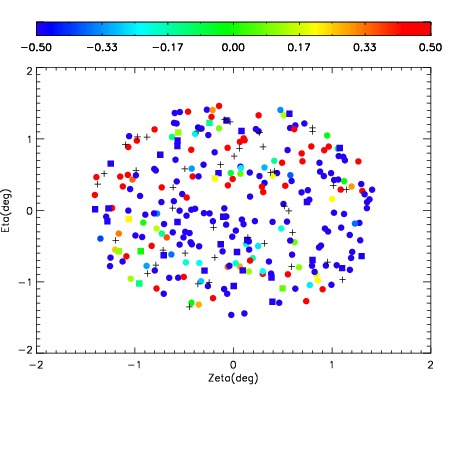
| Spatial mag deviation
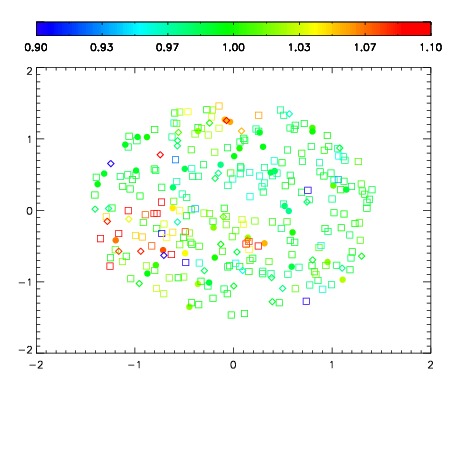
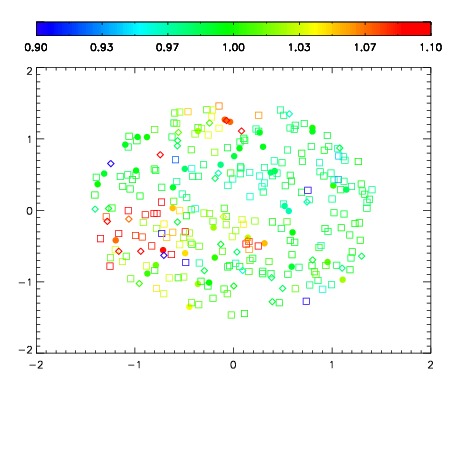
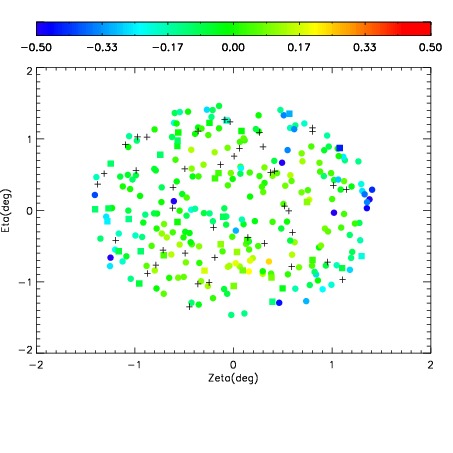
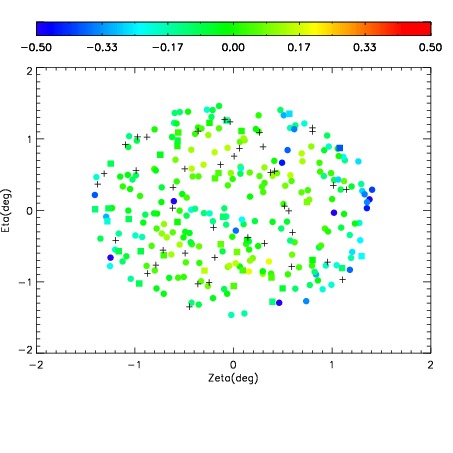
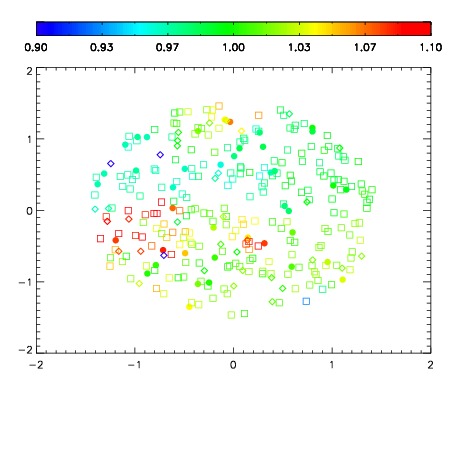
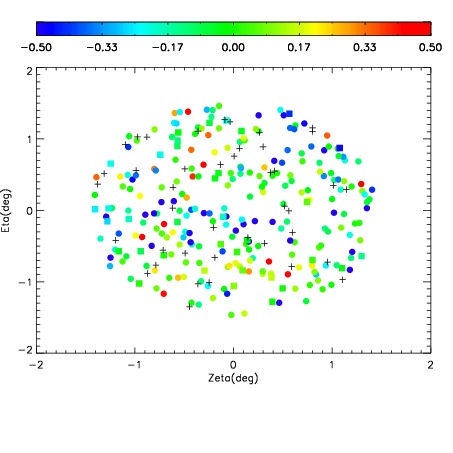
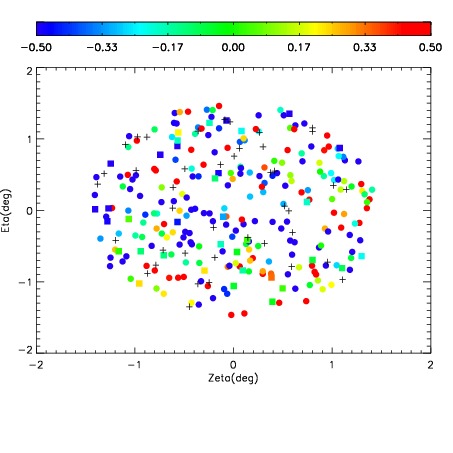
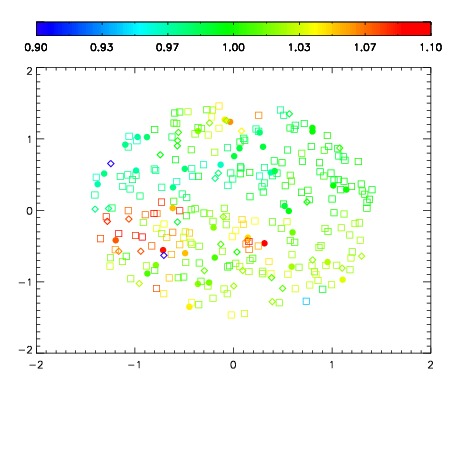
| Spatial sky 16325A emission deviations (filled: sky, open: star)
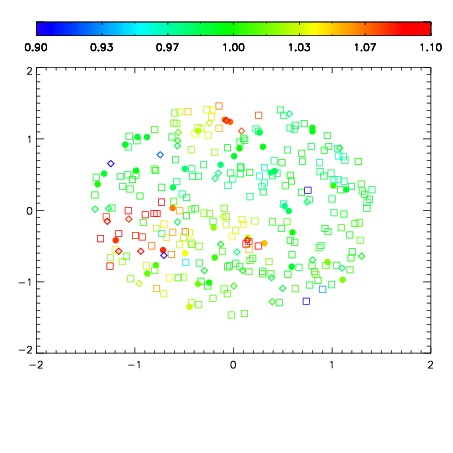
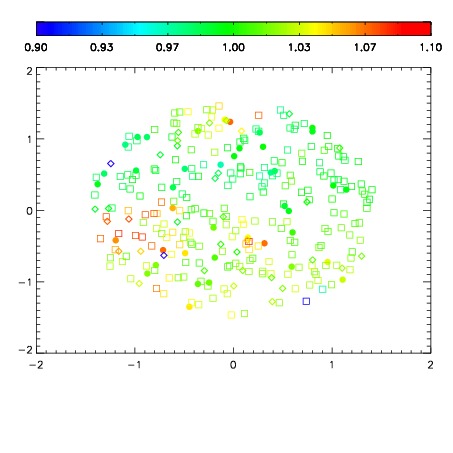
| Spatial sky continuum emission
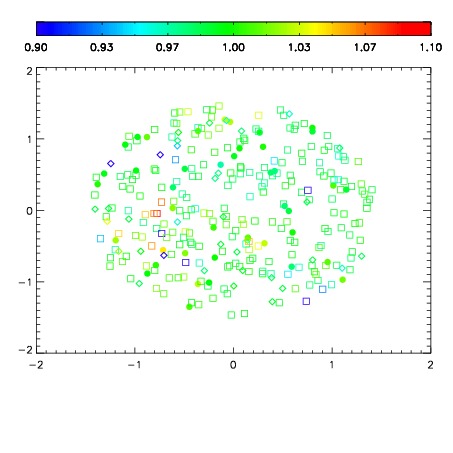
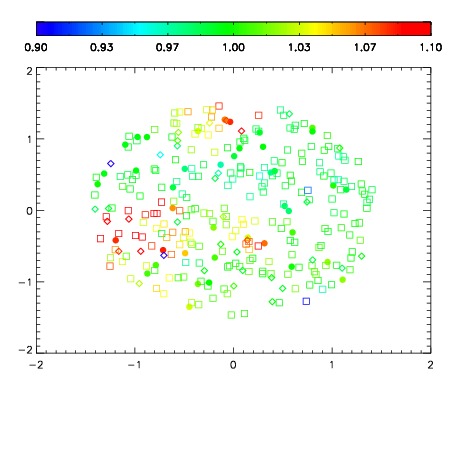
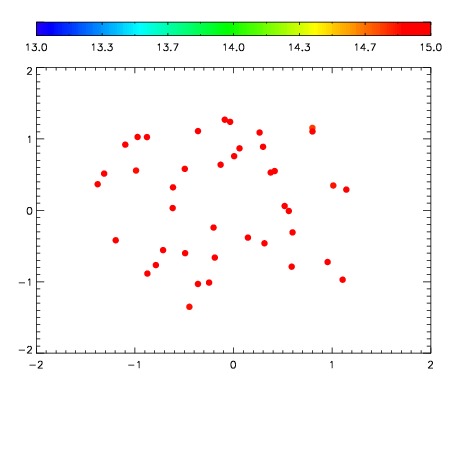
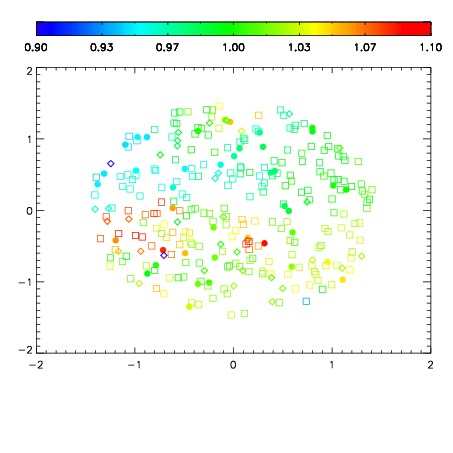
| Spatial sky telluric CO2 absorption deviations (filled: H < 10)
|
| 3220010
| 47
| | Red | Green | Blue
| | z | | 18.52
| | znorm | | 14.34
| | sky | 15.4 | 15.2 | 14.9
| | S/N | 9.8 | 18.3 | 18.9
| | S/N(c) | 8.4 | 16.9 | 17.6
| | SN(E/C) 0.98
|
| 
| 
| 
| 
| 
|
| 3220011
| 47
| | Red | Green | Blue
| | z | | 19.03
| | znorm | | 14.85
| | sky | 15.5 | 15.3 | 15.6
| | S/N | 14.7 | 24.9 | 26.0
| | S/N(c) | 12.7 | 23.4 | 24.5
| | SN(E/C) 0.97
|
| 
| 
| 
| 
| 
|
| 3220012
| 47
| | Red | Green | Blue
| | z | | 19.00
| | znorm | | 14.82
| | sky | 15.6 | 15.4 | 15.7
| | S/N | 14.2 | 24.3 | 25.5
| | S/N(c) | 12.3 | 22.8 | 23.8
| | SN(E/C) 0.98
|
| 
| 
| 
| 
| 
|
| 3220013
| 47
| | Red | Green | Blue
| | z | | 17.98
| | znorm | | 13.80
| | sky | 15.2 | 15.1 | 15.4
| | S/N | 6.6 | 13.1 | 13.3
| | S/N(c) | 5.5 | 12.0 | 12.1
| | SN(E/C) 0.99
|
| 
| 
| 
| 
| 
|
| 3220014
| 47
| | Red | Green | Blue
| | z | | 17.92
| | znorm | | 13.74
| | sky | 15.1 | 15.0 | 15.2
| | S/N | 6.1 | 13.0 | 12.7
| | S/N(c) | 5.2 | 11.5 | 11.7
| | SN(E/C) 0.97
|
| 
| 
| 
| 
| 
|
| 3220015
| 47
| | Red | Green | Blue
| | z | | 17.71
| | znorm | | 13.53
| | sky | 15.1 | 15.1 | 15.3
| | S/N | 5.3 | 11.0 | 11.1
| | S/N(c) | 4.6 | 9.9 | 10.1
| | SN(E/C) 1.00
|
| 
| 
| 
| 
| 
|
| 3220016
| 47
| | Red | Green | Blue
| | z | | 14.49
| | znorm | | 10.31
| | sky | 14.9 | 15.0 | 15.6
| | S/N | 0.1 | 0.9 | 0.7
| | S/N(c) | 0.2 | 0.8 | 0.6
| | SN(E/C) 0.96
|
| 
| 
| 
| 
| 
|
| 3220017
| 47
| | Red | Green | Blue
| | z | | 17.02
| | znorm | | 12.84
| | sky | 15.0 | 15.0 | 15.2
| | S/N | 2.7 | 6.7 | 7.0
| | S/N(c) | 2.4 | 5.9 | 6.2
| | SN(E/C) 0.97
|
| 
| 
| 
| 
| 
|
| 3220018
| 47
| | Red | Green | Blue
| | z | | 15.19
| | znorm | | 11.01
| | sky | 14.8 | 14.9 | 15.5
| | S/N | 0.4 | 1.7 | 1.5
| | S/N(c) | 0.5 | 1.3 | 1.4
| | SN(E/C) 1.01
|
| 
| 
| 
| 
| 
|
| 3220019
| 47
| | Red | Green | Blue
| | z | | 13.58
| | znorm | | 9.40
| | sky | 14.8 | 15.0 | 15.6
| | S/N | 0.0 | 0.5 | 0.3
| | S/N(c) | 0.0 | 0.0 | 0.0
| | SN(E/C) 1.50
|
| 
| 
| 
| 
| 
|
| 3220020
| 47
| | Red | Green | Blue
| | z | | 12.70
| | znorm | | 8.52
| | sky | 15.1 | 15.2 | 15.6
| | S/N | -0.1 | 0.1 | 0.2
| | S/N(c) | 0.0 | 0.0 | 0.0
| | SN(E/C) 2.61
|
| 
| 
| 
| 
| 
|
| 3220021
| 47
| | Red | Green | Blue
| | z | | 13.90
| | znorm | | 9.72
| | sky | 15.4 | 15.2 | 15.8
| | S/N | 0.2 | 0.5 | 0.5
| | S/N(c) | 0.0 | 0.0 | 0.0
| | SN(E/C) 1.23
|
| 
| 
| 
| 
| 
|