| Red | Green | Blue | |
| z | 17.64 | ||
| znorm | Inf | ||
| sky | -Inf | -Inf | -Inf |
| S/N | 14.1 | 26.9 | 27.7 |
| S/N(c) | 0.0 | 0.0 | 0.0 |
| SN(E/C) |
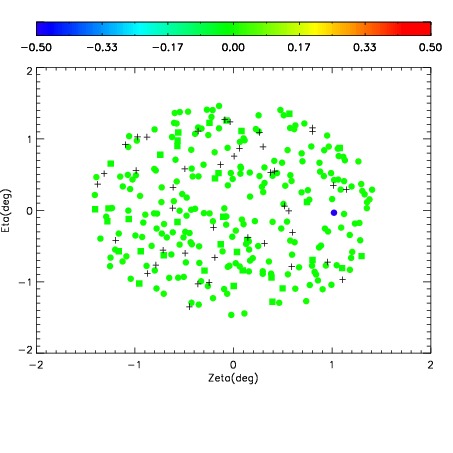
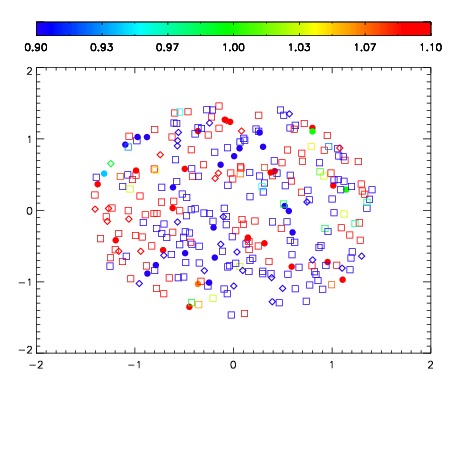
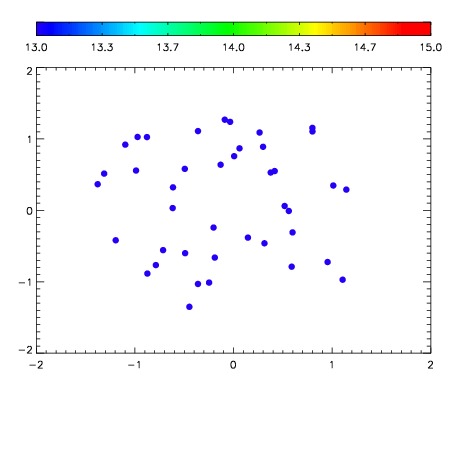

| Frame | Nreads | Zeropoints | Mag plots | Spatial mag deviation | Spatial sky 16325A emission deviations (filled: sky, open: star) | Spatial sky continuum emission | Spatial sky telluric CO2 absorption deviations (filled: H < 10) | |||||||||||||||||||||||
| 0 | 0 |
|
|
|
|
|
|
| IPAIR | NAME | SHIFT | NEWSHIFT | S/N | NAME | SHIFT | NEWSHIFT | S/N |
| 0 | 03220016 | 0.510098 | 0.00000 | 20.0041 | 03220017 | 0.00210347 | 0.507995 | 69.4363 |
| 1 | 03220011 | 0.507837 | 0.00226098 | 192.588 | 03220010 | 0.00000 | 0.510098 | 150.799 |
| 2 | 03220012 | 0.509417 | 0.000680983 | 187.839 | 03220013 | 0.00198815 | 0.508110 | 113.171 |
| 3 | 03220015 | 0.508221 | 0.00187701 | 100.848 | 03220014 | 0.000980053 | 0.509118 | 111.259 |