| Red | Green | Blue | |
| z | 17.64 | ||
| znorm | Inf | ||
| sky | -Inf | -Inf | -Inf |
| S/N | 24.0 | 44.2 | 47.1 |
| S/N(c) | 0.0 | 0.0 | 0.0 |
| SN(E/C) |
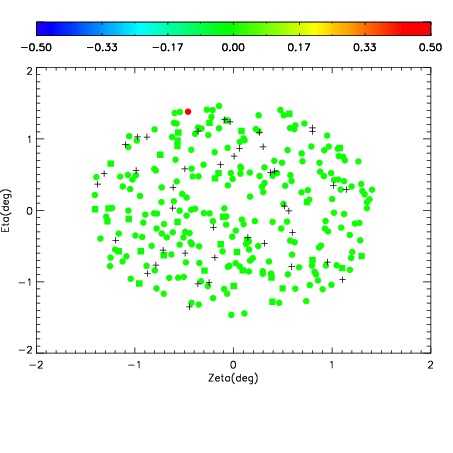
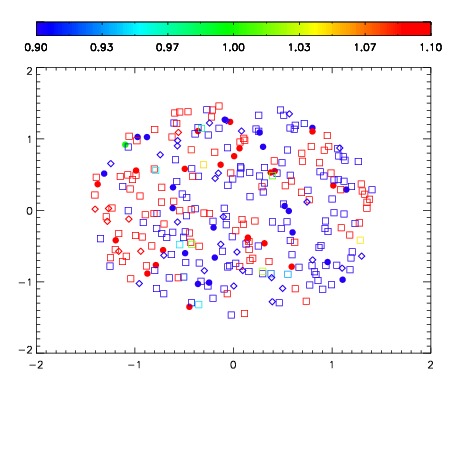


| Frame | Nreads | Zeropoints | Mag plots | Spatial mag deviation | Spatial sky 16325A emission deviations (filled: sky, open: star) | Spatial sky continuum emission | Spatial sky telluric CO2 absorption deviations (filled: H < 10) | |||||||||||||||||||||||
| 0 | 0 |
|
|
|
|
|
|
| IPAIR | NAME | SHIFT | NEWSHIFT | S/N | NAME | SHIFT | NEWSHIFT | S/N |
| 0 | 03480031 | 0.500414 | 0.00000 | 152.704 | 03480028 | 0.00110328 | 0.499311 | 154.156 |
| 1 | 03480026 | 0.498921 | 0.00149301 | 163.556 | 03480025 | 0.00000 | 0.500414 | 160.237 |
| 2 | 03480030 | 0.499028 | 0.00138602 | 158.611 | 03480029 | 0.000712909 | 0.499701 | 158.952 |
| 3 | 03480027 | 0.499618 | 0.000796020 | 143.954 | 03480032 | 0.000571392 | 0.499843 | 149.863 |