| Red | Green | Blue | |
| z | 17.64 | ||
| znorm | Inf | ||
| sky | -NaN | -Inf | -Inf |
| S/N | 31.2 | 56.2 | 61.0 |
| S/N(c) | 0.0 | 0.0 | 0.0 |
| SN(E/C) |
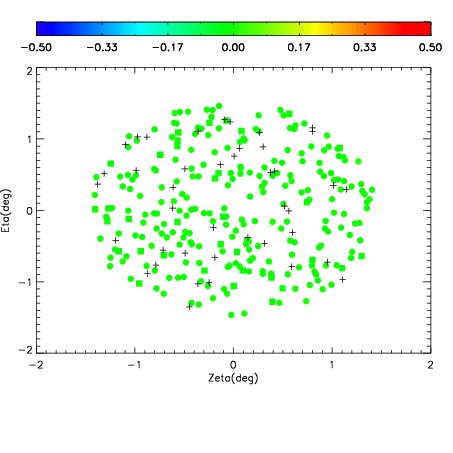
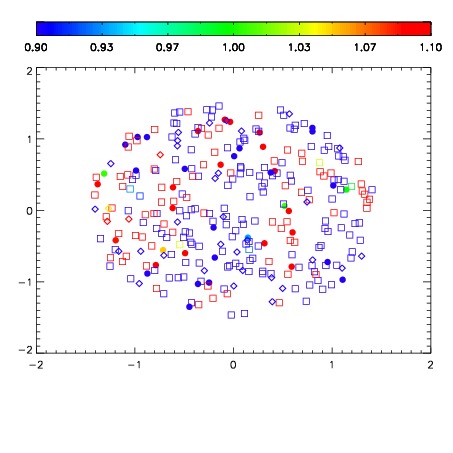
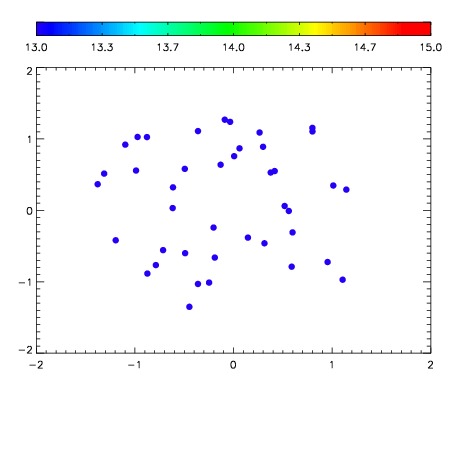

| Frame | Nreads | Zeropoints | Mag plots | Spatial mag deviation | Spatial sky 16325A emission deviations (filled: sky, open: star) | Spatial sky continuum emission | Spatial sky telluric CO2 absorption deviations (filled: H < 10) | |||||||||||||||||||||||
| 0 | 0 |
|
|
|
|
|
|
| IPAIR | NAME | SHIFT | NEWSHIFT | S/N | NAME | SHIFT | NEWSHIFT | S/N |
| 0 | 03640050 | 0.504430 | 0.00000 | 187.227 | 03640052 | -0.000792618 | 0.505223 | 190.845 |
| 1 | 03640046 | 0.502153 | 0.00227702 | 206.160 | 03640044 | 0.00000 | 0.504430 | 201.873 |
| 2 | 03640045 | 0.500162 | 0.00426799 | 205.411 | 03640047 | 0.000505404 | 0.503925 | 200.868 |
| 3 | 03640049 | 0.501379 | 0.00305098 | 198.627 | 03640048 | -0.000763369 | 0.505193 | 195.908 |
| 4 | 03640053 | 0.501225 | 0.00320500 | 189.184 | 03640051 | 0.000262122 | 0.504168 | 192.360 |