| Red | Green | Blue | |
| z | 17.64 | ||
| znorm | Inf | ||
| sky | -Inf | -Inf | -Inf |
| S/N | 29.1 | 49.7 | 54.8 |
| S/N(c) | 0.0 | 0.0 | 0.0 |
| SN(E/C) |

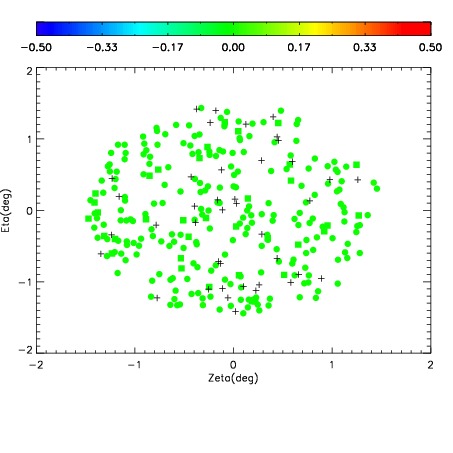
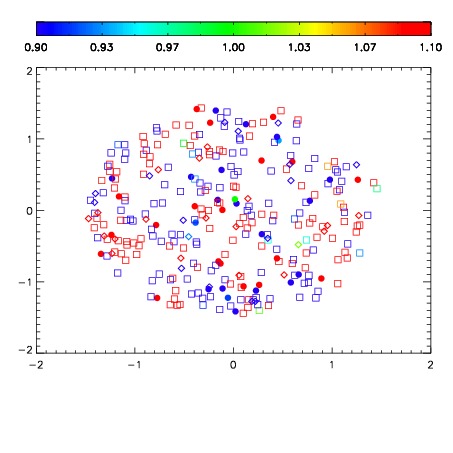
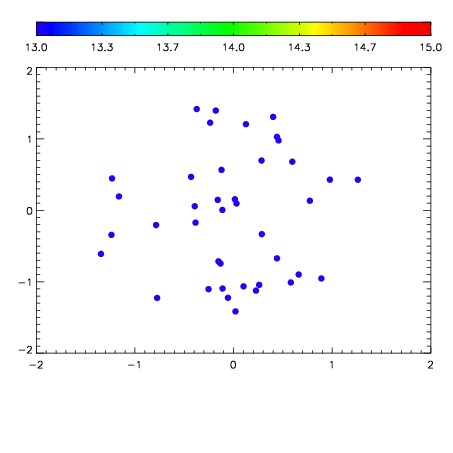

| Frame | Nreads | Zeropoints | Mag plots | Spatial mag deviation | Spatial sky 16325A emission deviations (filled: sky, open: star) | Spatial sky continuum emission | Spatial sky telluric CO2 absorption deviations (filled: H < 10) | |||||||||||||||||||||||
| 0 | 0 |
|
|
|
|
|
|
| IPAIR | NAME | SHIFT | NEWSHIFT | S/N | NAME | SHIFT | NEWSHIFT | S/N |
| 0 | 02630017 | 0.425164 | 0.00000 | 182.032 | 02630019 | -0.00573633 | 0.430900 | 188.567 |
| 1 | 02630020 | 0.419552 | 0.00561202 | 198.764 | 02630022 | -0.00290854 | 0.428073 | 206.200 |
| 2 | 02630024 | 0.413307 | 0.0118570 | 196.583 | 02630023 | -0.00450926 | 0.429673 | 202.588 |
| 3 | 02630021 | 0.422805 | 0.00235900 | 185.006 | 02630015 | 0.00000 | 0.425164 | 192.078 |
| 4 | 02630016 | 0.421223 | 0.00394100 | 177.843 | 02630018 | -0.00180582 | 0.426970 | 183.192 |