| Red | Green | Blue | |
| z | 17.64 | ||
| znorm | Inf | ||
| sky | -Inf | -NaN | -Inf |
| S/N | 26.0 | 47.3 | 48.7 |
| S/N(c) | 0.0 | 0.0 | 0.0 |
| SN(E/C) |
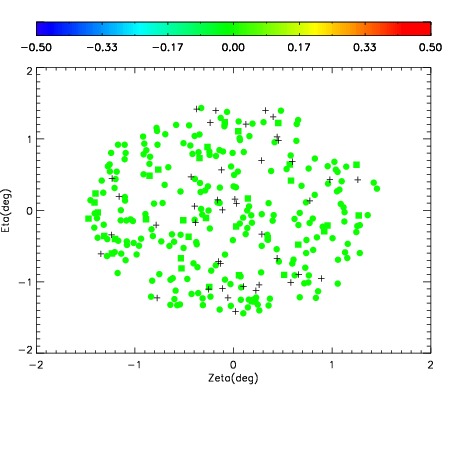
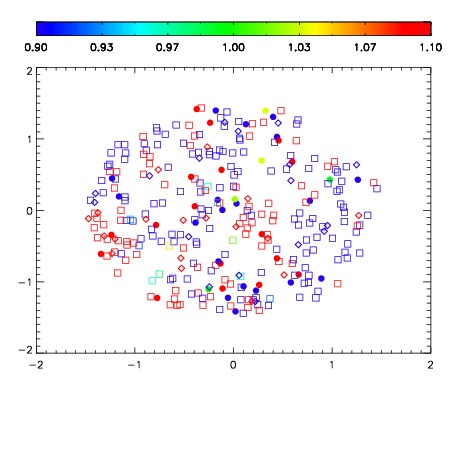
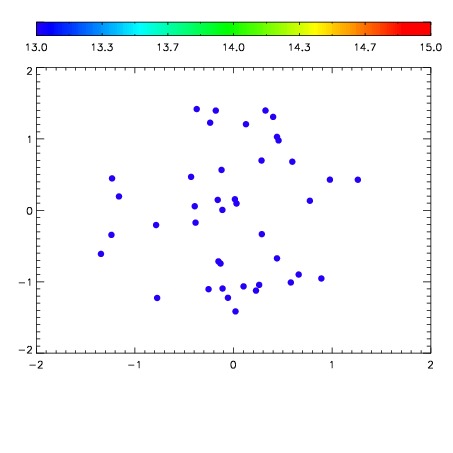

| Frame | Nreads | Zeropoints | Mag plots | Spatial mag deviation | Spatial sky 16325A emission deviations (filled: sky, open: star) | Spatial sky continuum emission | Spatial sky telluric CO2 absorption deviations (filled: H < 10) | |||||||||||||||||||||||
| 0 | 0 |
|
|
|
|
|
|
| IPAIR | NAME | SHIFT | NEWSHIFT | S/N | NAME | SHIFT | NEWSHIFT | S/N |
| 0 | 03180012 | 0.507121 | 0.00000 | 157.515 | 03180013 | 0.00445038 | 0.502671 | 161.225 |
| 1 | 03180016 | 0.502537 | 0.00458401 | 170.967 | 03180014 | 0.00380958 | 0.503311 | 167.691 |
| 2 | 03180015 | 0.500954 | 0.00616705 | 167.271 | 03180017 | 0.00286243 | 0.504259 | 166.031 |
| 3 | 03180011 | 0.505343 | 0.00177801 | 153.893 | 03180010 | 0.00000 | 0.507121 | 150.626 |