| Red | Green | Blue | |
| z | 17.64 | ||
| znorm | Inf | ||
| sky | -Inf | -Inf | -Inf |
| S/N | 20.5 | 35.1 | 41.3 |
| S/N(c) | 0.0 | 0.0 | 0.0 |
| SN(E/C) |
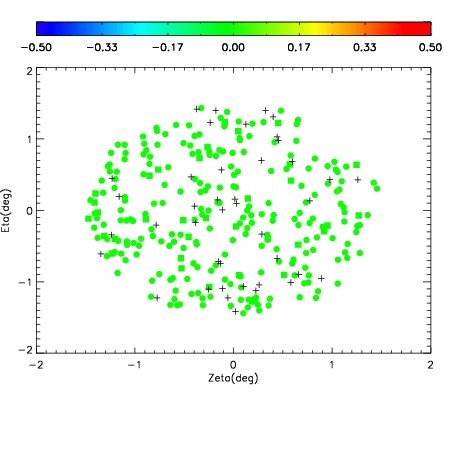
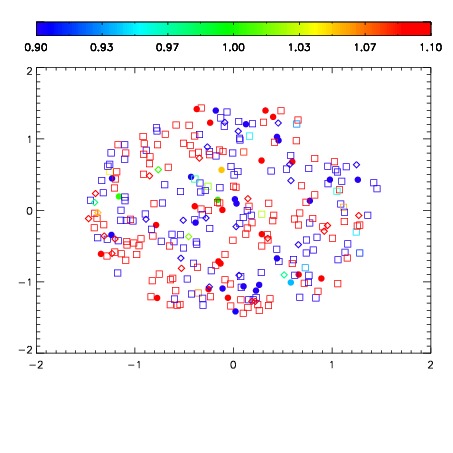
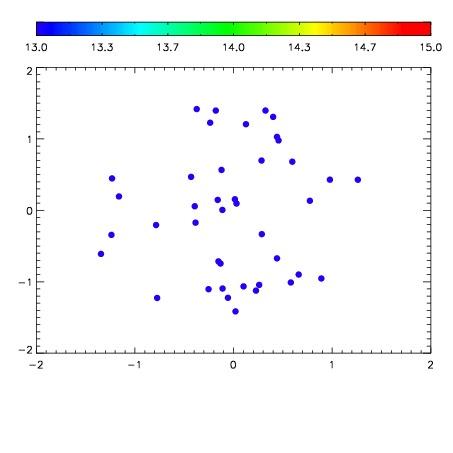

| Frame | Nreads | Zeropoints | Mag plots | Spatial mag deviation | Spatial sky 16325A emission deviations (filled: sky, open: star) | Spatial sky continuum emission | Spatial sky telluric CO2 absorption deviations (filled: H < 10) | |||||||||||||||||||||||
| 0 | 0 |
|
|
|
|
|
|
| IPAIR | NAME | SHIFT | NEWSHIFT | S/N | NAME | SHIFT | NEWSHIFT | S/N |
| 0 | 03340049 | 0.506101 | 0.00000 | 77.4514 | 03340047 | 0.00000 | 0.506101 | 148.278 |
| 1 | 03340052 | 0.498146 | 0.00795501 | 189.646 | 03340051 | -0.00106017 | 0.507161 | 175.295 |
| 2 | 03340053 | 0.499152 | 0.00694901 | 146.555 | 03340050 | 0.00242968 | 0.503671 | 170.472 |
| 3 | 03340048 | 0.503106 | 0.00299501 | 116.751 | 03340054 | 0.000217718 | 0.505883 | 163.396 |