| Red | Green | Blue | |
| z | 17.64 | ||
| znorm | Inf | ||
| sky | -NaN | -Inf | -Inf |
| S/N | 27.5 | 47.7 | 52.9 |
| S/N(c) | 0.0 | 0.0 | 0.0 |
| SN(E/C) |
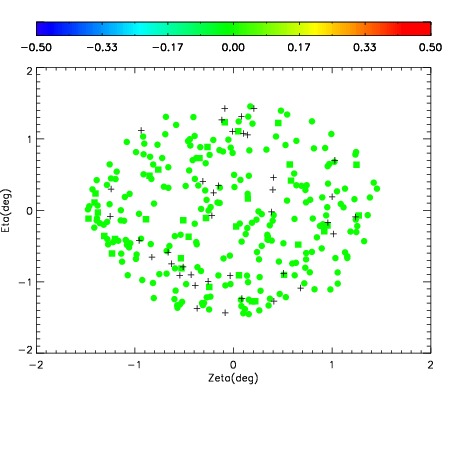
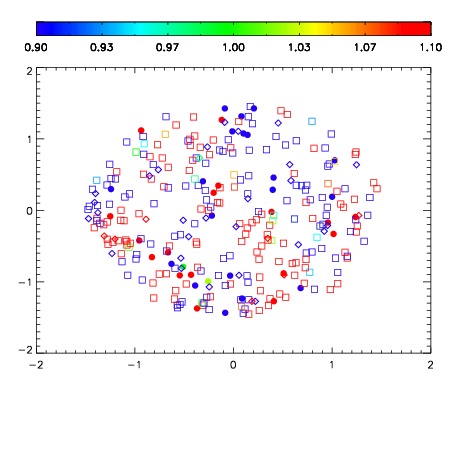
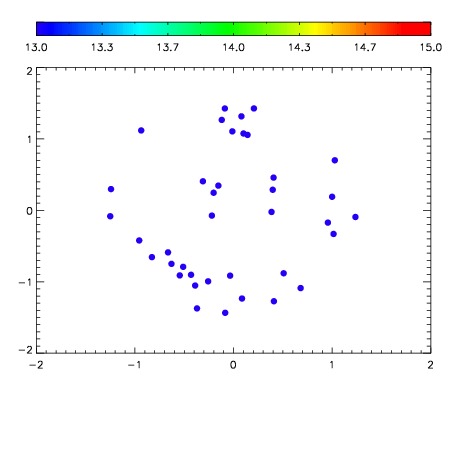

| Frame | Nreads | Zeropoints | Mag plots | Spatial mag deviation | Spatial sky 16325A emission deviations (filled: sky, open: star) | Spatial sky continuum emission | Spatial sky telluric CO2 absorption deviations (filled: H < 10) | |||||||||||||||||||||||
| 0 | 0 |
|
|
|
|
|
|
| IPAIR | NAME | SHIFT | NEWSHIFT | S/N | NAME | SHIFT | NEWSHIFT | S/N |
| 0 | 03410061 | 0.498984 | 0.00000 | 228.803 | 03410059 | 0.00000 | 0.498984 | 228.825 |
| 1 | 03410060 | 0.496662 | 0.00232202 | 236.544 | 03410066 | 0.00165605 | 0.497328 | 231.390 |
| 2 | 03410064 | 0.494058 | 0.00492600 | 226.875 | 03410062 | -0.000668114 | 0.499652 | 225.408 |
| 3 | 03410065 | 0.496635 | 0.00234902 | 225.746 | 03410063 | -0.000975377 | 0.499959 | 223.674 |