| Red | Green | Blue | |
| z | 17.64 | ||
| znorm | Inf | ||
| sky | -Inf | -Inf | -Inf |
| S/N | 15.2 | 27.8 | 29.3 |
| S/N(c) | 0.0 | 0.0 | 0.0 |
| SN(E/C) |
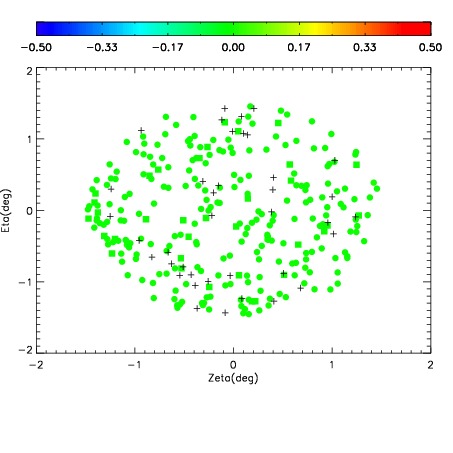
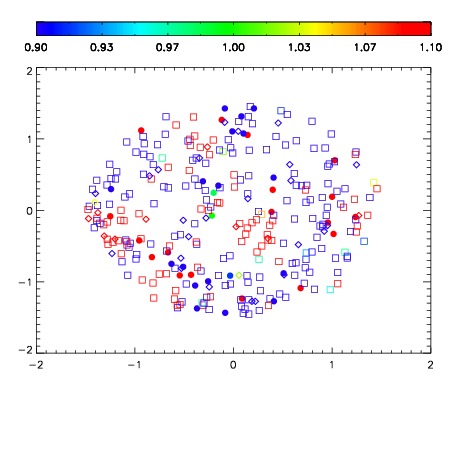
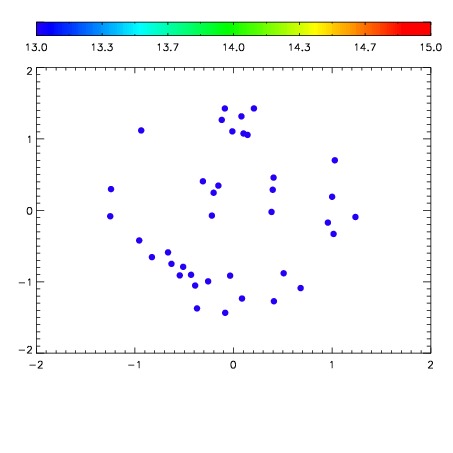

| Frame | Nreads | Zeropoints | Mag plots | Spatial mag deviation | Spatial sky 16325A emission deviations (filled: sky, open: star) | Spatial sky continuum emission | Spatial sky telluric CO2 absorption deviations (filled: H < 10) | |||||||||||||||||||||||
| 0 | 0 |
|
|
|
|
|
|
| IPAIR | NAME | SHIFT | NEWSHIFT | S/N | NAME | SHIFT | NEWSHIFT | S/N |
| 0 | 03480012 | 0.508875 | 0.00000 | 79.6103 | 03480010 | 0.00000 | 0.508875 | 84.2393 |
| 1 | 03480016 | 0.504086 | 0.00478899 | 216.007 | 03480017 | 0.00169952 | 0.507176 | 221.926 |
| 2 | 03480015 | 0.502930 | 0.00594503 | 118.507 | 03480014 | -0.000115486 | 0.508991 | 135.657 |
| 3 | 03480011 | 0.504908 | 0.00396699 | 105.155 | 03480013 | 0.00190758 | 0.506967 | 103.047 |