| Red | Green | Blue | |
| z | 17.64 | ||
| znorm | Inf | ||
| sky | -Inf | -Inf | -Inf |
| S/N | 31.3 | 54.6 | 59.6 |
| S/N(c) | 0.0 | 0.0 | 0.0 |
| SN(E/C) |


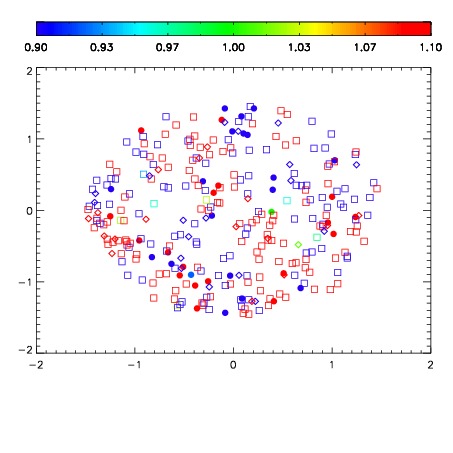
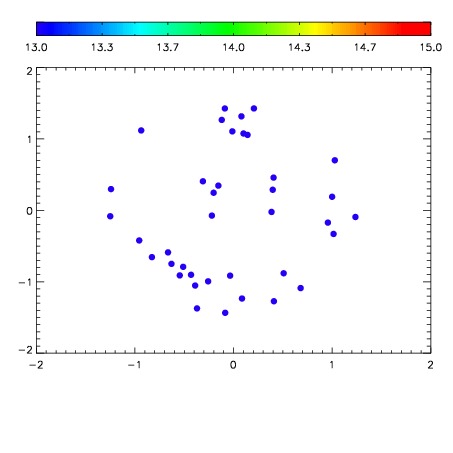

| Frame | Nreads | Zeropoints | Mag plots | Spatial mag deviation | Spatial sky 16325A emission deviations (filled: sky, open: star) | Spatial sky continuum emission | Spatial sky telluric CO2 absorption deviations (filled: H < 10) | |||||||||||||||||||||||
| 0 | 0 |
|
|
|
|
|
|
| IPAIR | NAME | SHIFT | NEWSHIFT | S/N | NAME | SHIFT | NEWSHIFT | S/N |
| 0 | 03670030 | 0.501736 | 0.00000 | 225.825 | 03670032 | 0.00231574 | 0.499420 | 227.802 |
| 1 | 03670025 | 0.499023 | 0.00271299 | 233.850 | 03670024 | 0.00000 | 0.501736 | 231.412 |
| 2 | 03670026 | 0.501392 | 0.000343978 | 233.262 | 03670027 | 0.00131773 | 0.500418 | 230.507 |
| 3 | 03670033 | 0.499819 | 0.00191697 | 228.064 | 03670031 | 0.00381227 | 0.497924 | 227.875 |
| 4 | 03670029 | 0.500664 | 0.00107199 | 225.485 | 03670028 | 0.000660359 | 0.501076 | 222.213 |