| Red | Green | Blue | |
| z | 17.64 | ||
| znorm | Inf | ||
| sky | -Inf | -Inf | -Inf |
| S/N | 17.7 | 31.8 | 37.8 |
| S/N(c) | 0.0 | 0.0 | 0.0 |
| SN(E/C) |
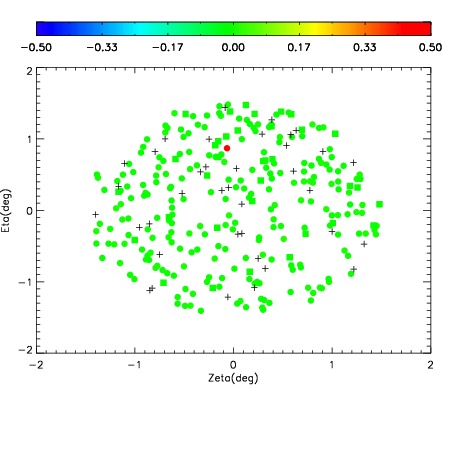
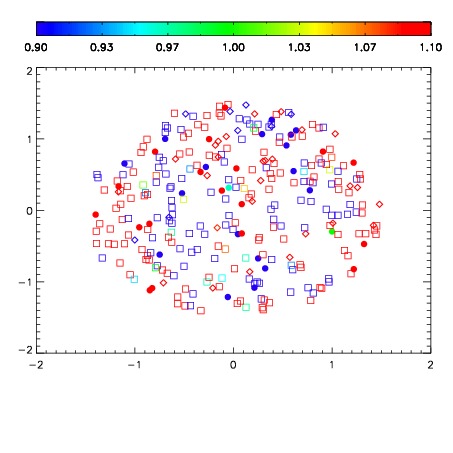
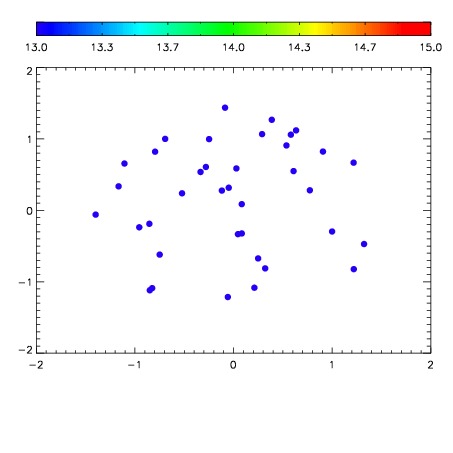

| Frame | Nreads | Zeropoints | Mag plots | Spatial mag deviation | Spatial sky 16325A emission deviations (filled: sky, open: star) | Spatial sky continuum emission | Spatial sky telluric CO2 absorption deviations (filled: H < 10) | |||||||||||||||||||||||
| 0 | 0 |
|
|
|
|
|
|
| IPAIR | NAME | SHIFT | NEWSHIFT | S/N | NAME | SHIFT | NEWSHIFT | S/N |
| 0 | 03490031 | 0.506220 | 0.00000 | 149.776 | 03490032 | 0.00475801 | 0.501462 | 140.984 |
| 1 | 03490027 | 0.505572 | 0.000647962 | 186.136 | 03490025 | 0.00000 | 0.506220 | 183.755 |
| 2 | 03490026 | 0.505072 | 0.00114799 | 184.306 | 03490029 | -8.21410e-05 | 0.506302 | 147.673 |
| 3 | 03490030 | 0.504617 | 0.00160301 | 139.366 | 03490028 | -4.05200e-05 | 0.506261 | 128.871 |