| Red | Green | Blue | |
| z | 17.64 | ||
| znorm | Inf | ||
| sky | -Inf | -Inf | -Inf |
| S/N | 32.5 | 53.2 | 64.1 |
| S/N(c) | 0.0 | 0.0 | 0.0 |
| SN(E/C) |
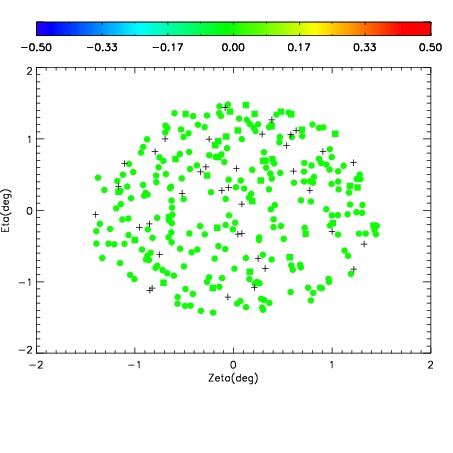
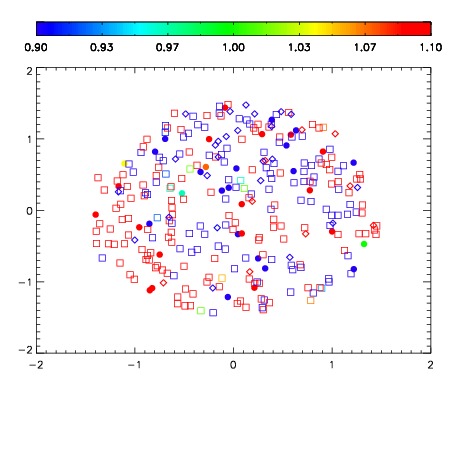
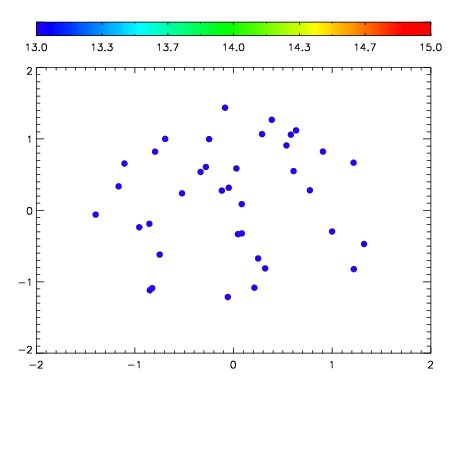

| Frame | Nreads | Zeropoints | Mag plots | Spatial mag deviation | Spatial sky 16325A emission deviations (filled: sky, open: star) | Spatial sky continuum emission | Spatial sky telluric CO2 absorption deviations (filled: H < 10) | |||||||||||||||||||||||
| 0 | 0 |
|
|
|
|
|
|
| IPAIR | NAME | SHIFT | NEWSHIFT | S/N | NAME | SHIFT | NEWSHIFT | S/N |
| 0 | 03700025 | 0.499198 | 0.00000 | 226.382 | 03700026 | -0.00128514 | 0.500483 | 222.334 |
| 1 | 03700024 | 0.494267 | 0.00493100 | 225.000 | 03700034 | -0.000944590 | 0.500143 | 220.748 |
| 2 | 03700029 | 0.495388 | 0.00380999 | 216.890 | 03700023 | 0.00000 | 0.499198 | 219.994 |
| 3 | 03700028 | 0.494316 | 0.00488198 | 216.144 | 03700027 | -0.000886924 | 0.500085 | 218.996 |
| 4 | 03700033 | 0.499082 | 0.000115991 | 212.227 | 03700030 | -0.000195660 | 0.499394 | 215.042 |
| 5 | 03700032 | 0.495626 | 0.00357199 | 209.776 | 03700031 | -0.000219669 | 0.499418 | 211.957 |