| Red | Green | Blue | |
| z | 17.64 | ||
| znorm | Inf | ||
| sky | -Inf | -Inf | -Inf |
| S/N | 21.4 | 38.6 | 43.0 |
| S/N(c) | 0.0 | 0.0 | 0.0 |
| SN(E/C) |
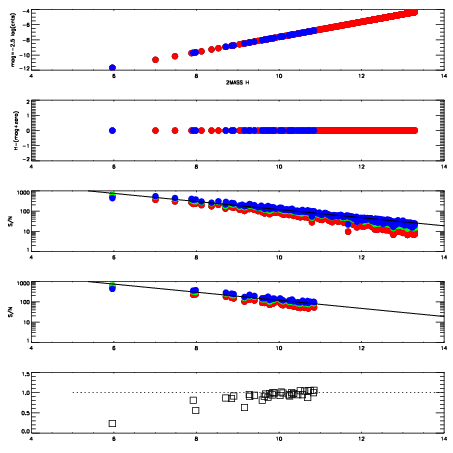
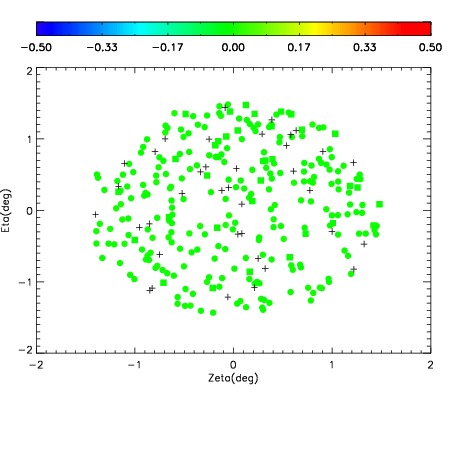

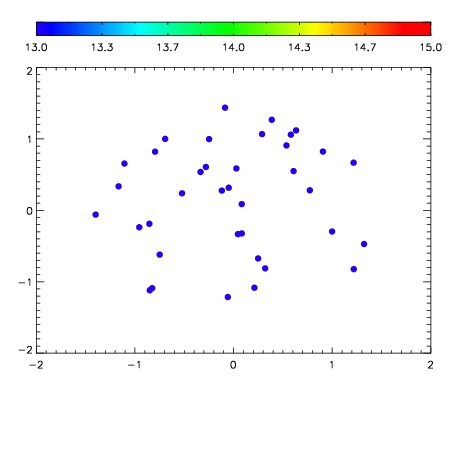

| Frame | Nreads | Zeropoints | Mag plots | Spatial mag deviation | Spatial sky 16325A emission deviations (filled: sky, open: star) | Spatial sky continuum emission | Spatial sky telluric CO2 absorption deviations (filled: H < 10) | |||||||||||||||||||||||
| 0 | 0 |
|
|
|
|
|
|
| IPAIR | NAME | SHIFT | NEWSHIFT | S/N | NAME | SHIFT | NEWSHIFT | S/N |
| 0 | 03750035 | 0.507446 | 0.00000 | 197.868 | 03750036 | 0.000462713 | 0.506983 | 205.329 |
| 1 | 03750034 | 0.504321 | 0.00312501 | 186.810 | 03750033 | -0.000258176 | 0.507704 | 182.130 |
| 2 | 03750031 | 0.506108 | 0.00133801 | 165.098 | 03750032 | 0.000991443 | 0.506455 | 171.702 |
| 3 | 03750030 | 0.501179 | 0.00626701 | 161.465 | 03750029 | 0.00000 | 0.507446 | 168.914 |