| Red | Green | Blue | |
| z | 17.64 | ||
| znorm | Inf | ||
| sky | -Inf | -Inf | -Inf |
| S/N | 34.5 | 60.3 | 67.4 |
| S/N(c) | 0.0 | 0.0 | 0.0 |
| SN(E/C) |
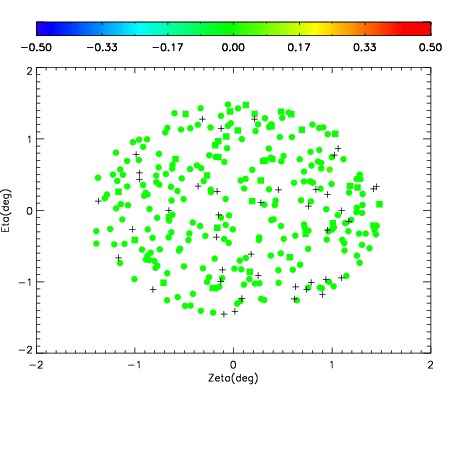
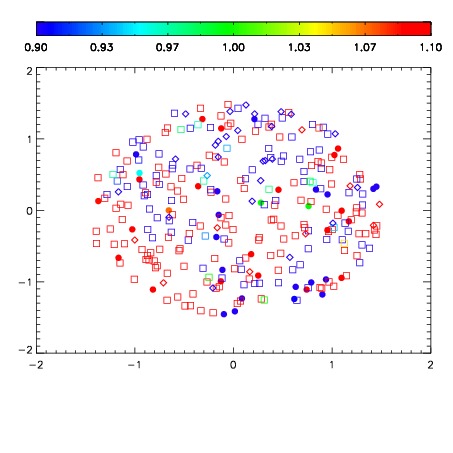
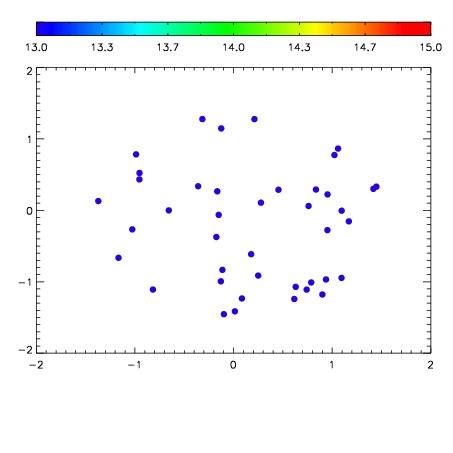

| Frame | Nreads | Zeropoints | Mag plots | Spatial mag deviation | Spatial sky 16325A emission deviations (filled: sky, open: star) | Spatial sky continuum emission | Spatial sky telluric CO2 absorption deviations (filled: H < 10) | |||||||||||||||||||||||
| 0 | 0 |
|
|
|
|
|
|
| IPAIR | NAME | SHIFT | NEWSHIFT | S/N | NAME | SHIFT | NEWSHIFT | S/N |
| 0 | 03710031 | 0.501981 | 0.00000 | 201.949 | 03710032 | 0.000429405 | 0.501552 | 200.202 |
| 1 | 03710030 | 0.496444 | 0.00553703 | 202.766 | 03710033 | -0.000694744 | 0.502676 | 200.959 |
| 2 | 03710027 | 0.499942 | 0.00203902 | 201.697 | 03710029 | 0.000215163 | 0.501766 | 200.076 |
| 3 | 03710034 | 0.497218 | 0.00476301 | 201.523 | 03710028 | 0.00134460 | 0.500636 | 199.648 |
| 4 | 03710035 | 0.500550 | 0.00143105 | 200.013 | 03710036 | 0.00307624 | 0.498905 | 199.002 |
| 5 | 03710026 | 0.495905 | 0.00607601 | 197.576 | 03710025 | 0.00000 | 0.501981 | 188.181 |