| Red | Green | Blue | |
| z | 17.64 | ||
| znorm | Inf | ||
| sky | -Inf | -Inf | -Inf |
| S/N | 16.3 | 31.0 | 33.0 |
| S/N(c) | 0.0 | 0.0 | 0.0 |
| SN(E/C) |

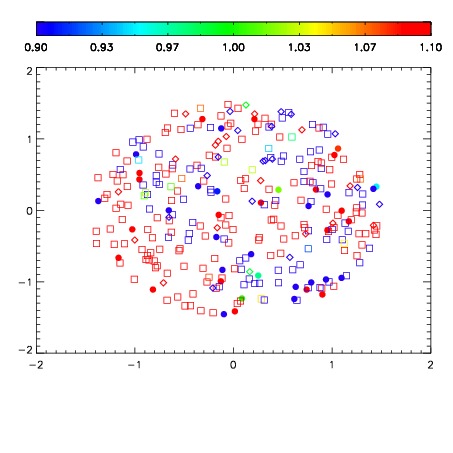
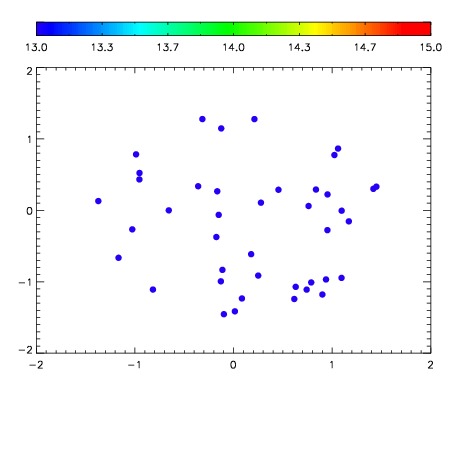

| Frame | Nreads | Zeropoints | Mag plots | Spatial mag deviation | Spatial sky 16325A emission deviations (filled: sky, open: star) | Spatial sky continuum emission | Spatial sky telluric CO2 absorption deviations (filled: H < 10) | |||||||||||||||||||||||
| 0 | 0 |
|
|
|
|
|
|
| IPAIR | NAME | SHIFT | NEWSHIFT | S/N | NAME | SHIFT | NEWSHIFT | S/N |
| 0 | 03760031 | 0.509456 | 0.00000 | 118.040 | 03760032 | 0.00170205 | 0.507754 | 100.874 |
| 1 | 03760035 | 0.509163 | 0.000292957 | 156.668 | 03760036 | -0.000143413 | 0.509599 | 162.767 |
| 2 | 03760030 | 0.507195 | 0.00226098 | 139.713 | 03760029 | 0.00000 | 0.509456 | 154.234 |
| 3 | 03760034 | 0.507449 | 0.00200701 | 132.849 | 03760033 | 0.000880238 | 0.508576 | 101.353 |