| Red | Green | Blue | |
| z | 17.64 | ||
| znorm | Inf | ||
| sky | -Inf | -Inf | -Inf |
| S/N | 26.4 | 46.8 | 49.2 |
| S/N(c) | 0.0 | 0.0 | 0.0 |
| SN(E/C) |
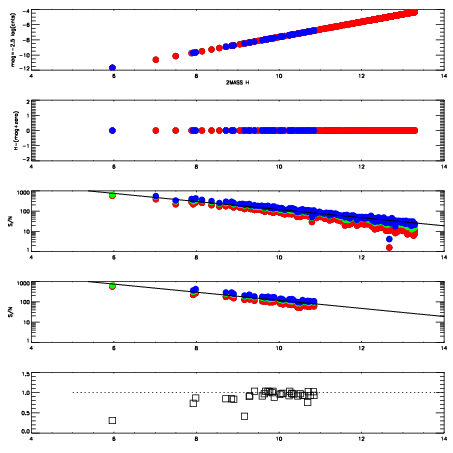
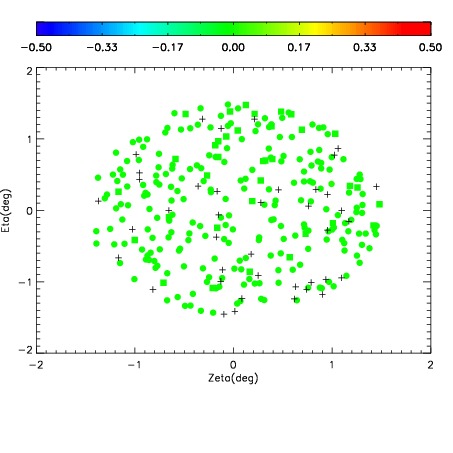
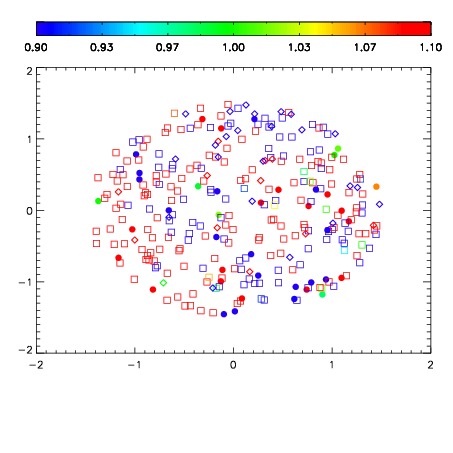
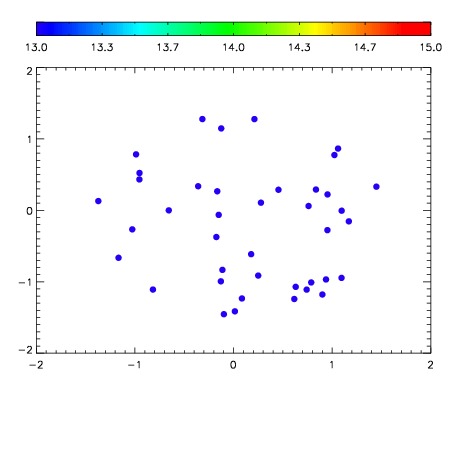

| Frame | Nreads | Zeropoints | Mag plots | Spatial mag deviation | Spatial sky 16325A emission deviations (filled: sky, open: star) | Spatial sky continuum emission | Spatial sky telluric CO2 absorption deviations (filled: H < 10) | |||||||||||||||||||||||
| 0 | 0 |
|
|
|
|
|
|
| IPAIR | NAME | SHIFT | NEWSHIFT | S/N | NAME | SHIFT | NEWSHIFT | S/N |
| 0 | 04010021 | 0.492714 | 0.00000 | 191.392 | 04010022 | 0.000857824 | 0.491856 | 198.821 |
| 1 | 04010025 | 0.491798 | 0.000915974 | 193.821 | 04010026 | 0.00527851 | 0.487435 | 201.681 |
| 2 | 04010024 | 0.491093 | 0.00162098 | 183.797 | 04010023 | 0.00378785 | 0.488926 | 191.607 |
| 3 | 04010020 | 0.492258 | 0.000455976 | 158.014 | 04010019 | 0.00000 | 0.492714 | 141.152 |