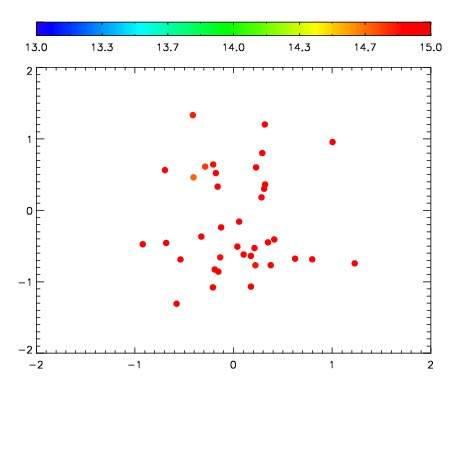
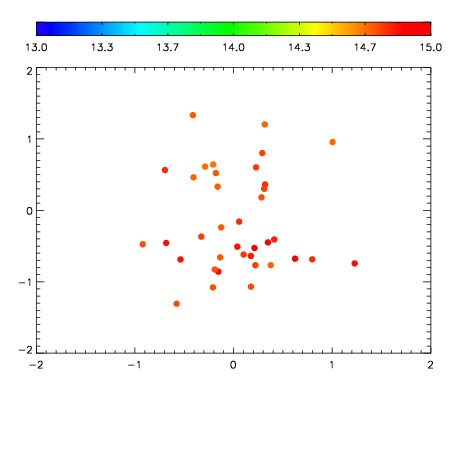
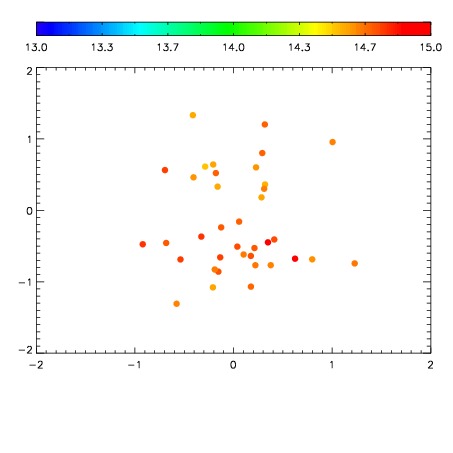
| Frame | Nreads | Zeropoints | Mag plots
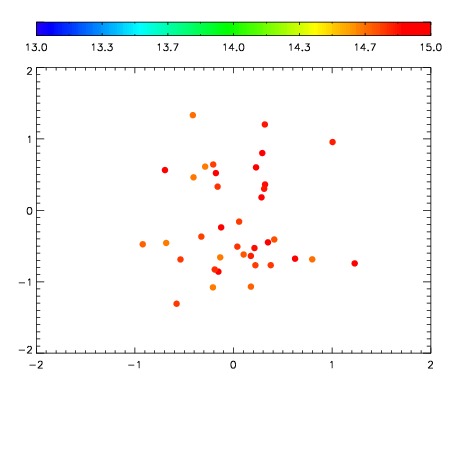
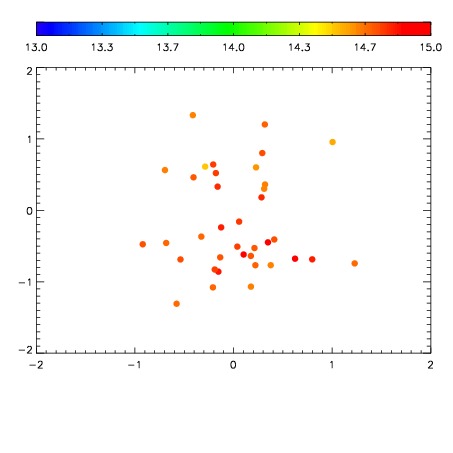
| Spatial mag deviation
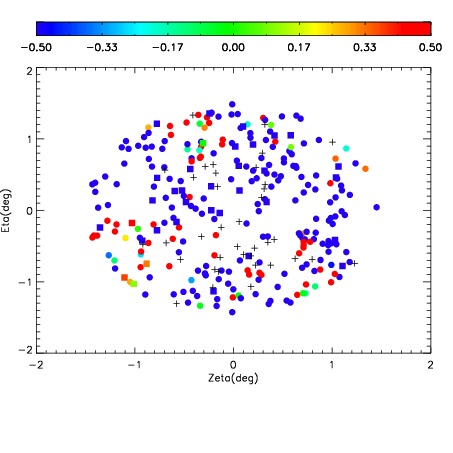
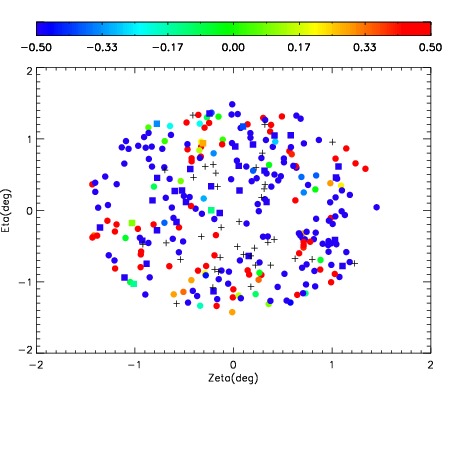
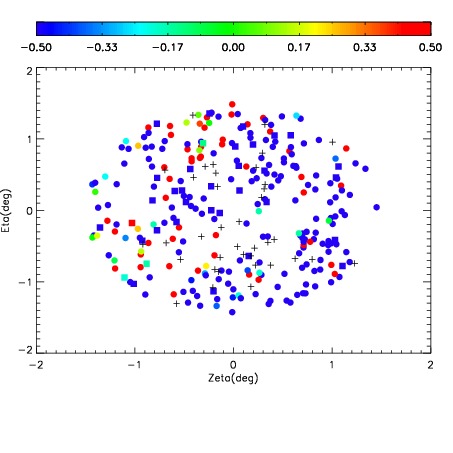
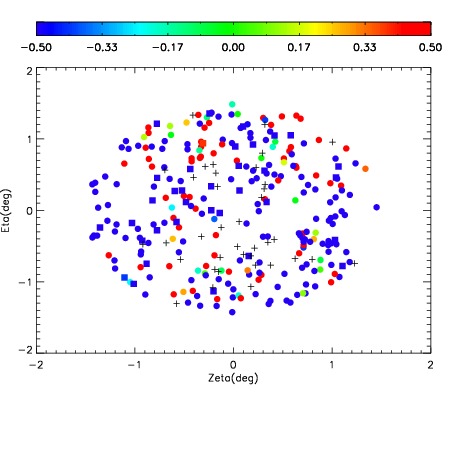
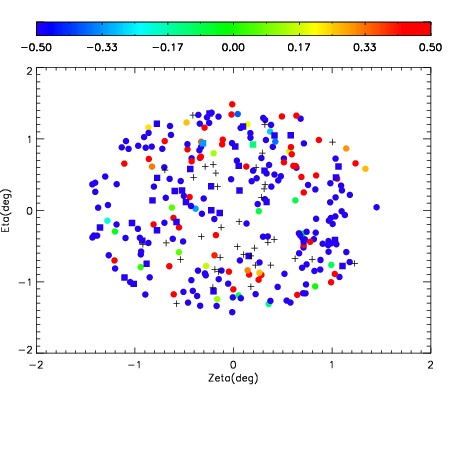
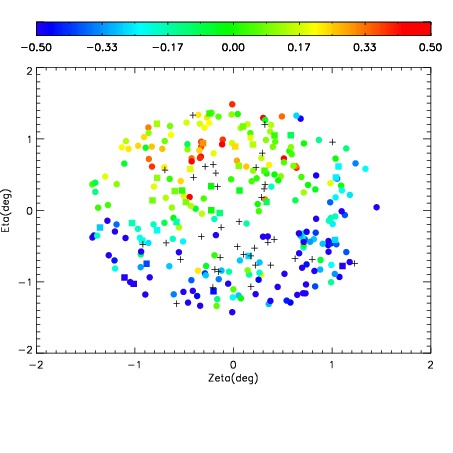
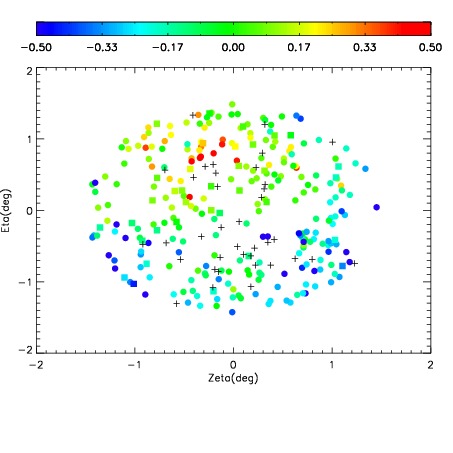
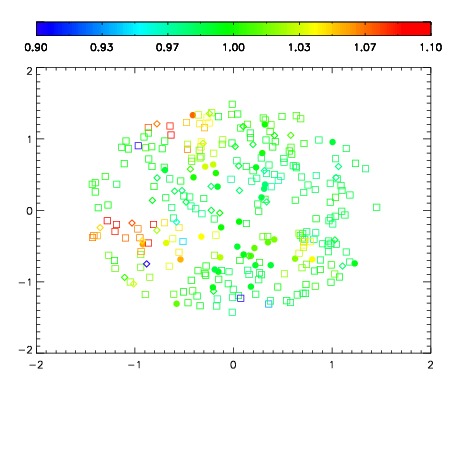
| Spatial sky 16325A emission deviations (filled: sky, open: star)
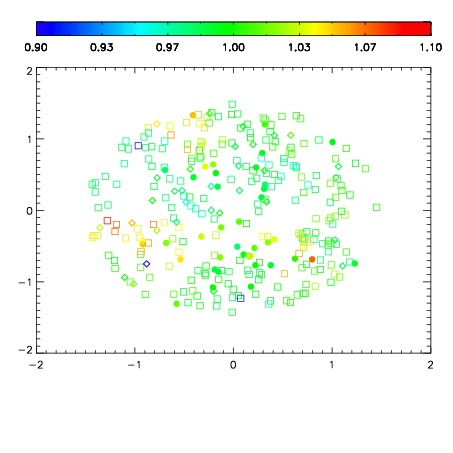
| Spatial sky continuum emission
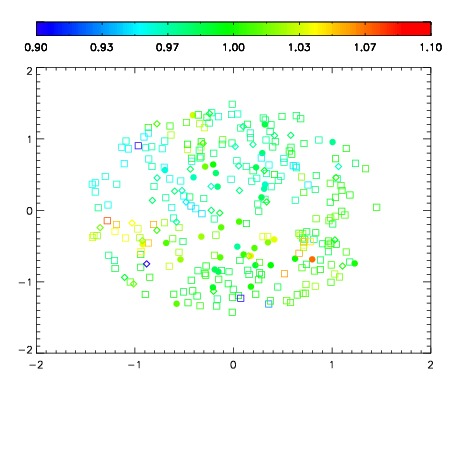
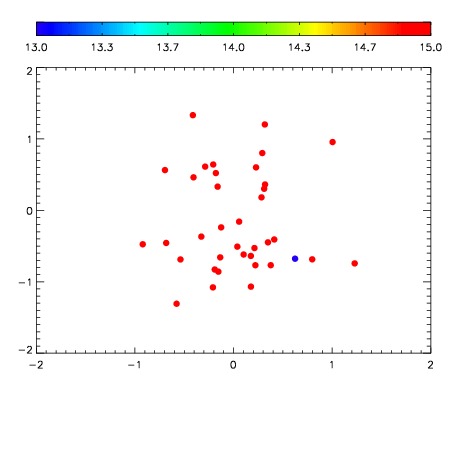
| Spatial sky telluric CO2 absorption deviations (filled: H < 10)
|
| 3220029
| 47
| | Red | Green | Blue
| | z | | 12.96
| | znorm | | 8.78
| | sky | 14.9 | 14.8 | 14.7
| | S/N | -0.0 | 0.0 | -0.9
| | S/N(c) | 0.0 | 0.0 | 0.0
| | SN(E/C) 3.32
|
| 
| 
| 
| 
| 
|
| 3220030
| 47
| | Red | Green | Blue
| | z | | 12.94
| | znorm | | 8.76
| | sky | 15.2 | 14.9 | 15.4
| | S/N | -0.0 | 0.2 | -0.6
| | S/N(c) | 0.0 | 0.0 | 0.0
| | SN(E/C) 3.07
|
| 
| 
| 
| 
| 
|
| 3220031
| 47
| | Red | Green | Blue
| | z | | 12.77
| | znorm | | 8.59
| | sky | 15.2 | 15.3 | 15.8
| | S/N | 0.1 | 0.1 | -0.8
| | S/N(c) | 0.0 | 0.0 | 0.0
| | SN(E/C) 5.22
|
| 
| 
| 
| 
| 
|
| 3220032
| 47
| | Red | Green | Blue
| | z | | 12.88
| | znorm | | 8.70
| | sky | 15.4 | 15.6 | 15.8
| | S/N | -0.0 | 0.2 | -0.9
| | S/N(c) | 0.0 | 0.0 | 0.0
| | SN(E/C) 3.29
|
| 
| 
| 
| 
| 
|
| 3220033
| 47
| | Red | Green | Blue
| | z | | 12.98
| | znorm | | 8.80
| | sky | 14.8 | 14.8 | 15.0
| | S/N | 0.1 | 0.1 | -0.5
| | S/N(c) | 0.0 | 0.0 | 0.0
| | SN(E/C) 5.72
|
| 
| 
| 
| 
| 
|
| 3220034
| 47
| | Red | Green | Blue
| | z | | 15.71
| | znorm | | 11.53
| | sky | 14.6 | 14.7 | 14.8
| | S/N | 0.9 | 3.0 | 2.1
| | S/N(c) | 0.9 | 2.3 | 2.4
| | SN(E/C) 0.91
|
| 
| 
| 
| 
| 
|
| 3220035
| 47
| | Red | Green | Blue
| | z | | 15.29
| | znorm | | 11.11
| | sky | 14.7 | 14.7 | 14.9
| | S/N | 0.5 | 1.7 | 1.1
| | S/N(c) | 0.5 | 1.4 | 1.7
| | SN(E/C) 0.98
|
| 
| 
| 
| 
| 
|
| 3220036
| 47
| | Red | Green | Blue
| | z | | 15.78
| | znorm | | 11.60
| | sky | 14.7 | 14.7 | 14.9
| | S/N | 1.0 | 2.5 | 2.2
| | S/N(c) | 0.9 | 2.1 | 2.3
| | SN(E/C) 0.99
|
| 
| 
| 
| 
| 
|