| Red | Green | Blue | |
| z | 17.65 | ||
| znorm | 13.47 | ||
| sky | 16.3 | 16.0 | 15.1 |
| S/N | 0.9 | 2.2 | 2.3 |
| S/N(c) | 0.0 | 0.0 | 0.0 |
| SN(E/C) |
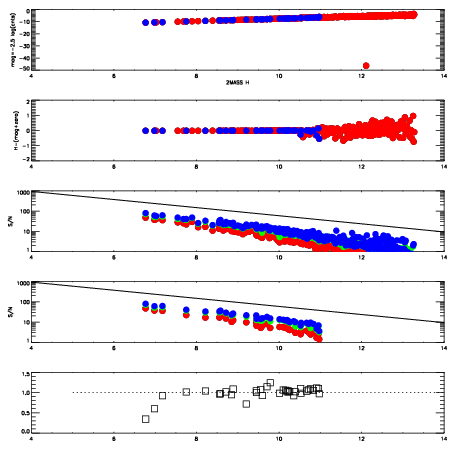
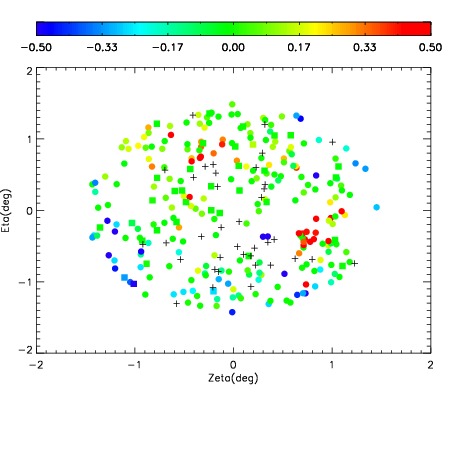
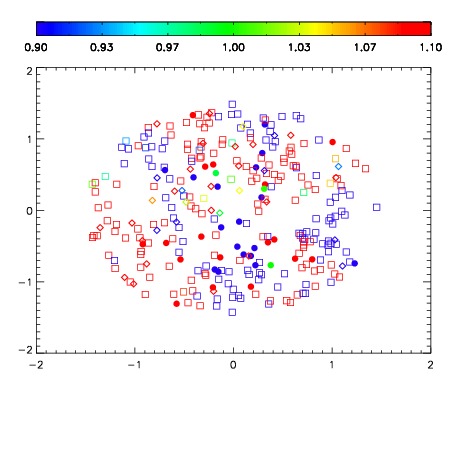
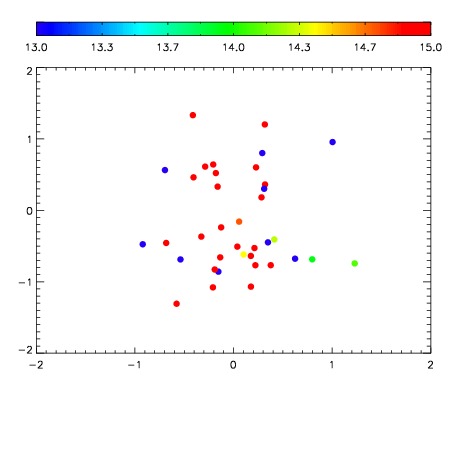

| Frame | Nreads | Zeropoints | Mag plots | Spatial mag deviation | Spatial sky 16325A emission deviations (filled: sky, open: star) | Spatial sky continuum emission | Spatial sky telluric CO2 absorption deviations (filled: H < 10) | |||||||||||||||||||||||
| 0 | 47 |
|
|
|
|
|
|
| IPAIR | NAME | SHIFT | NEWSHIFT | S/N | NAME | SHIFT | NEWSHIFT | S/N |
| 0 | 03220034 | 0.516809 | 0.00000 | 41.8319 | 03220036 | 0.00354789 | 0.513261 | 41.0553 |