| Red | Green | Blue | |
| z | 17.64 | ||
| znorm | Inf | ||
| sky | -Inf | -Inf | -Inf |
| S/N | 19.5 | 32.2 | 37.4 |
| S/N(c) | 0.0 | 0.0 | 0.0 |
| SN(E/C) |
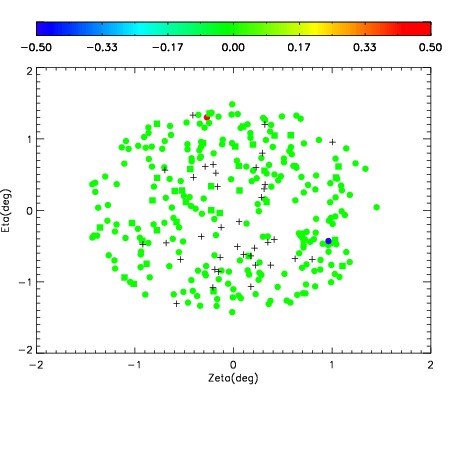
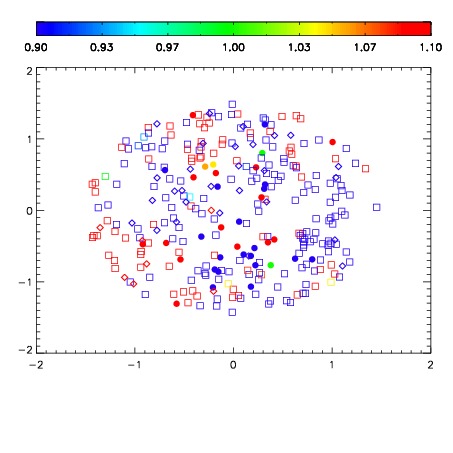
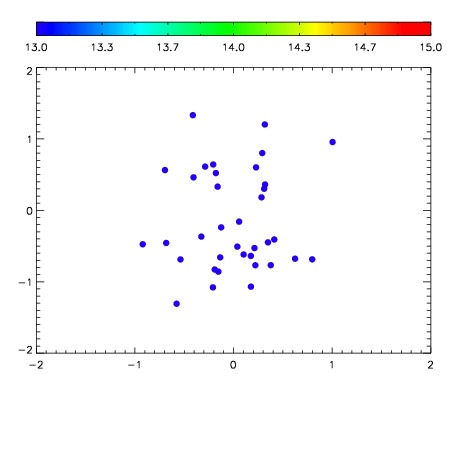

| Frame | Nreads | Zeropoints | Mag plots | Spatial mag deviation | Spatial sky 16325A emission deviations (filled: sky, open: star) | Spatial sky continuum emission | Spatial sky telluric CO2 absorption deviations (filled: H < 10) | |||||||||||||||||||||||
| 0 | 0 |
|
|
|
|
|
|
| IPAIR | NAME | SHIFT | NEWSHIFT | S/N | NAME | SHIFT | NEWSHIFT | S/N |
| 0 | 03420042 | 0.498433 | 0.00000 | 190.057 | 03420036 | 0.00000 | 0.498433 | 188.178 |
| 1 | 03420037 | 0.492474 | 0.00595900 | 205.862 | 03420039 | 0.00179468 | 0.496638 | 209.586 |
| 2 | 03420038 | 0.494055 | 0.00437799 | 202.290 | 03420040 | 0.000147103 | 0.498286 | 202.402 |
| 3 | 03420041 | 0.495373 | 0.00305998 | 197.414 | 03420043 | 0.00178432 | 0.496649 | 198.682 |