| Red | Green | Blue | |
| z | 17.64 | ||
| znorm | Inf | ||
| sky | -Inf | -Inf | -Inf |
| S/N | 32.7 | 56.1 | 62.2 |
| S/N(c) | 0.0 | 0.0 | 0.0 |
| SN(E/C) |
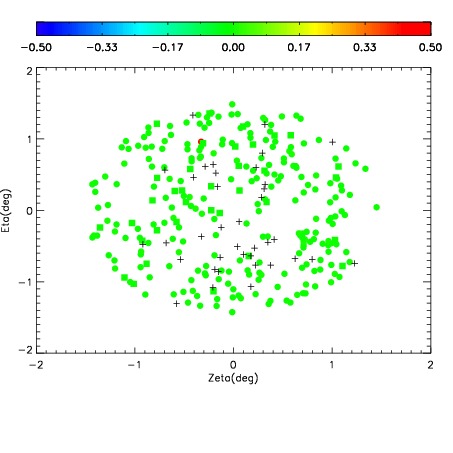
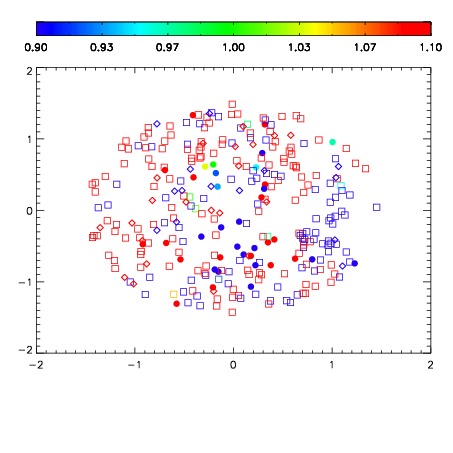
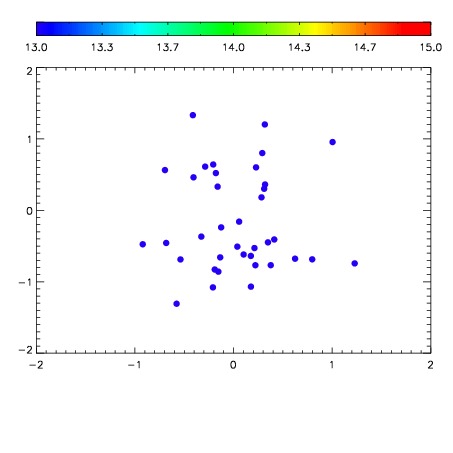

| Frame | Nreads | Zeropoints | Mag plots | Spatial mag deviation | Spatial sky 16325A emission deviations (filled: sky, open: star) | Spatial sky continuum emission | Spatial sky telluric CO2 absorption deviations (filled: H < 10) | |||||||||||||||||||||||
| 0 | 0 |
|
|
|
|
|
|
| IPAIR | NAME | SHIFT | NEWSHIFT | S/N | NAME | SHIFT | NEWSHIFT | S/N |
| 0 | 03750042 | 0.515808 | 0.00000 | 204.773 | 03750044 | 0.00200963 | 0.513798 | 205.883 |
| 1 | 03750050 | 0.512962 | 0.00284600 | 224.890 | 03750051 | 0.00583080 | 0.509977 | 223.894 |
| 2 | 03750049 | 0.507076 | 0.00873196 | 223.021 | 03750048 | 0.00442995 | 0.511378 | 215.010 |
| 3 | 03750045 | 0.507595 | 0.00821298 | 209.115 | 03750047 | 0.00666584 | 0.509142 | 210.336 |
| 4 | 03750046 | 0.510247 | 0.00556099 | 206.712 | 03750043 | 0.00209721 | 0.513711 | 206.102 |
| 5 | 03750041 | 0.507536 | 0.00827199 | 198.557 | 03750040 | 0.00000 | 0.515808 | 199.776 |