| Red | Green | Blue | |
| z | 17.64 | ||
| znorm | Inf | ||
| sky | -Inf | -Inf | -Inf |
| S/N | 27.8 | 46.8 | 51.8 |
| S/N(c) | 0.0 | 0.0 | 0.0 |
| SN(E/C) |
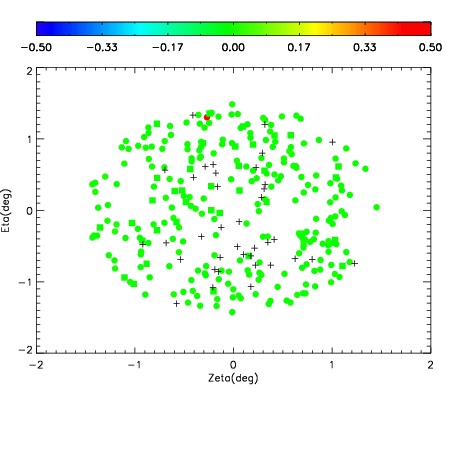
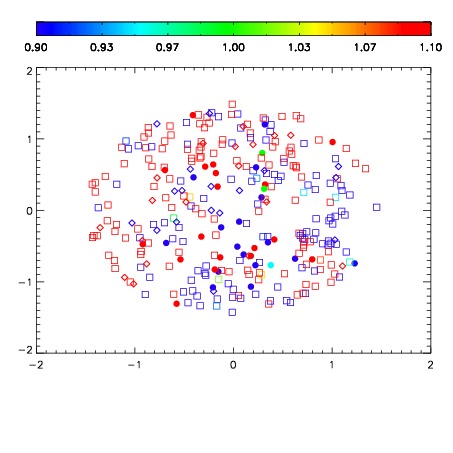
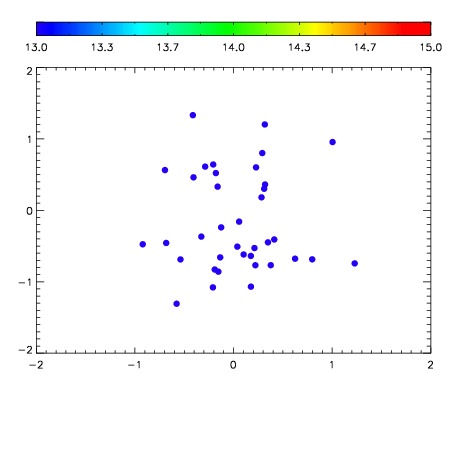

| Frame | Nreads | Zeropoints | Mag plots | Spatial mag deviation | Spatial sky 16325A emission deviations (filled: sky, open: star) | Spatial sky continuum emission | Spatial sky telluric CO2 absorption deviations (filled: H < 10) | |||||||||||||||||||||||
| 0 | 0 |
|
|
|
|
|
|
| IPAIR | NAME | SHIFT | NEWSHIFT | S/N | NAME | SHIFT | NEWSHIFT | S/N |
| 0 | 03950029 | 0.498591 | 0.00000 | 220.282 | 03950030 | -0.000304833 | 0.498896 | 214.153 |
| 1 | 03950032 | 0.497179 | 0.00141200 | 226.989 | 03950034 | -0.00203178 | 0.500623 | 223.971 |
| 2 | 03950033 | 0.497645 | 0.000946015 | 225.653 | 03950031 | -0.00309206 | 0.501683 | 222.430 |
| 3 | 03950028 | 0.497866 | 0.000725001 | 223.247 | 03950027 | 0.00000 | 0.498591 | 222.102 |