| Red | Green | Blue | |
| z | 17.64 | ||
| znorm | Inf | ||
| sky | -Inf | -Inf | -Inf |
| S/N | 20.7 | 37.1 | 38.6 |
| S/N(c) | 0.0 | 0.0 | 0.0 |
| SN(E/C) |
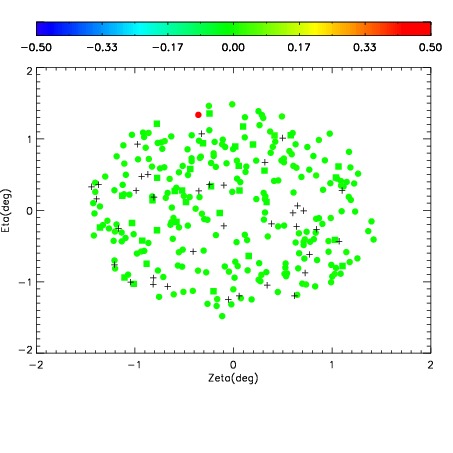
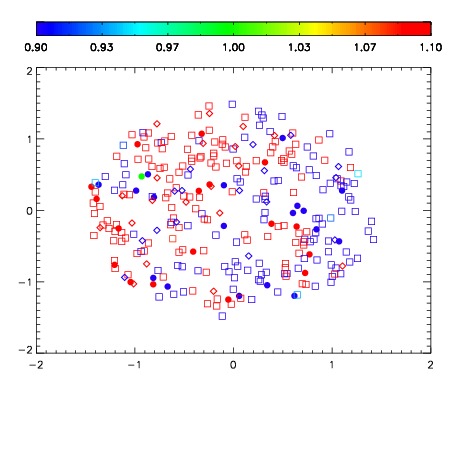
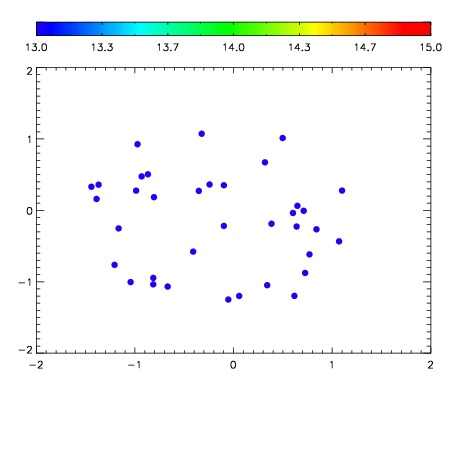

| Frame | Nreads | Zeropoints | Mag plots | Spatial mag deviation | Spatial sky 16325A emission deviations (filled: sky, open: star) | Spatial sky continuum emission | Spatial sky telluric CO2 absorption deviations (filled: H < 10) | |||||||||||||||||||||||
| 0 | 0 |
|
|
|
|
|
|
| IPAIR | NAME | SHIFT | NEWSHIFT | S/N | NAME | SHIFT | NEWSHIFT | S/N |
| 0 | 03960023 | 0.495174 | 0.00000 | 167.136 | 03960021 | 0.00000 | 0.495174 | 188.202 |
| 1 | 03960027 | 0.495110 | 6.39856e-05 | 203.589 | 03960028 | 0.00921710 | 0.485957 | 222.781 |
| 2 | 03960022 | 0.495005 | 0.000168979 | 141.919 | 03960024 | 0.00318750 | 0.491986 | 165.702 |
| 3 | 03960026 | 0.494997 | 0.000176996 | 135.531 | 03960025 | 0.0139090 | 0.481265 | 139.684 |