| Red | Green | Blue | |
| z | 17.64 | ||
| znorm | Inf | ||
| sky | -Inf | -Inf | -Inf |
| S/N | 26.0 | 43.9 | 47.6 |
| S/N(c) | 0.0 | 0.0 | 0.0 |
| SN(E/C) |
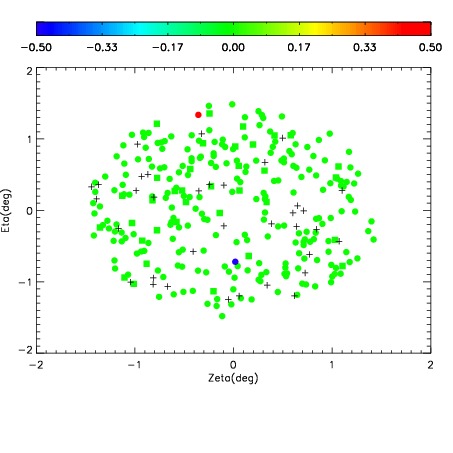
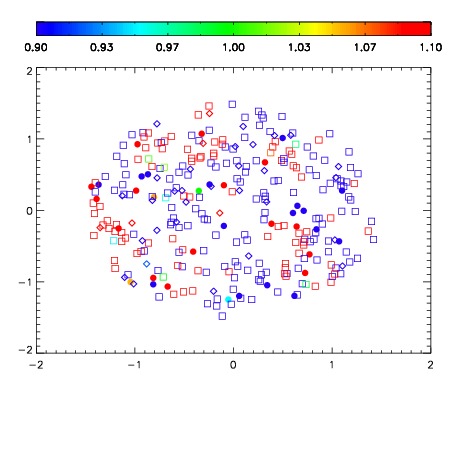
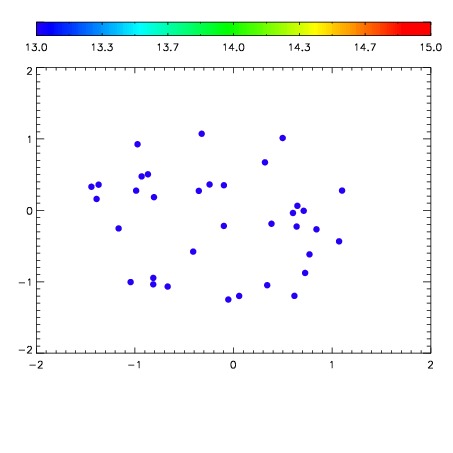

| Frame | Nreads | Zeropoints | Mag plots | Spatial mag deviation | Spatial sky 16325A emission deviations (filled: sky, open: star) | Spatial sky continuum emission | Spatial sky telluric CO2 absorption deviations (filled: H < 10) | |||||||||||||||||||||||
| 0 | 0 |
|
|
|
|
|
|
| IPAIR | NAME | SHIFT | NEWSHIFT | S/N | NAME | SHIFT | NEWSHIFT | S/N |
| 0 | 04030025 | 0.505674 | 0.00000 | 230.545 | 04030027 | -0.000293367 | 0.505967 | 232.926 |
| 1 | 04030024 | 0.498353 | 0.00732100 | 240.754 | 04030023 | 0.00000 | 0.505674 | 238.308 |
| 2 | 04030028 | 0.497725 | 0.00794899 | 238.496 | 04030026 | 0.000631533 | 0.505042 | 236.755 |