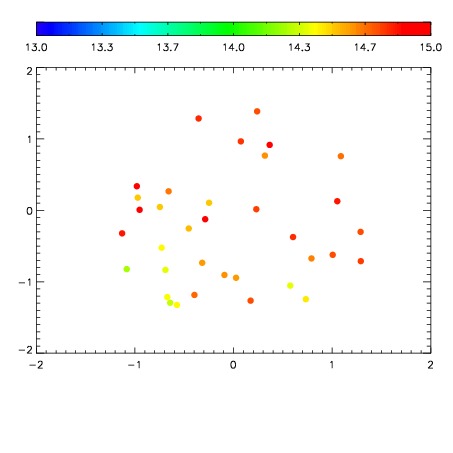
| Frame | Nreads | Zeropoints | Mag plots
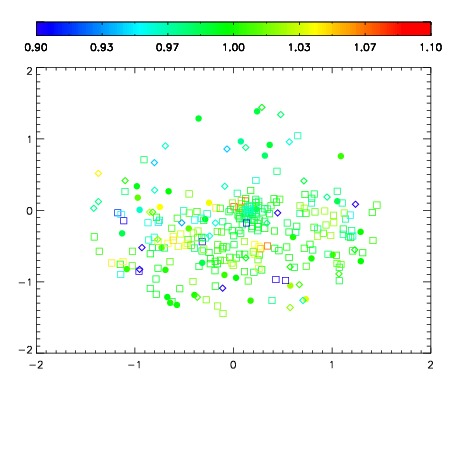
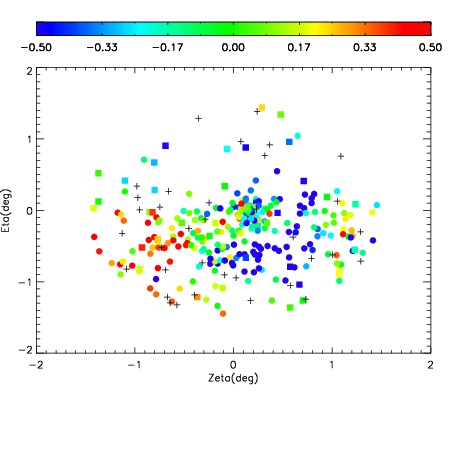
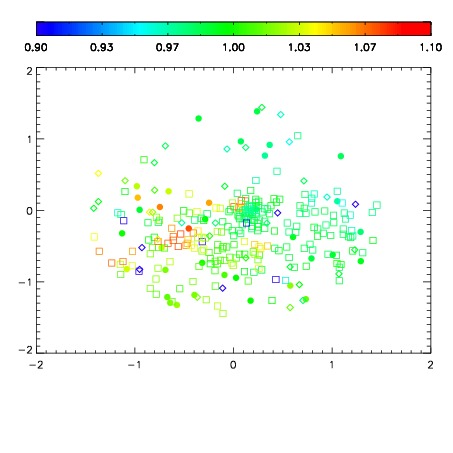
| Spatial mag deviation
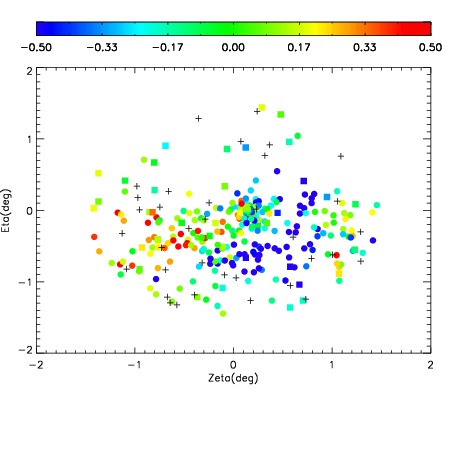
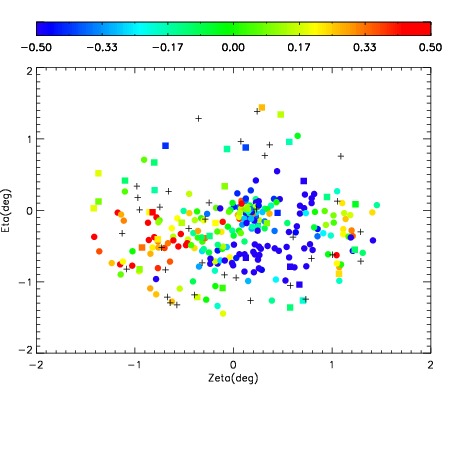
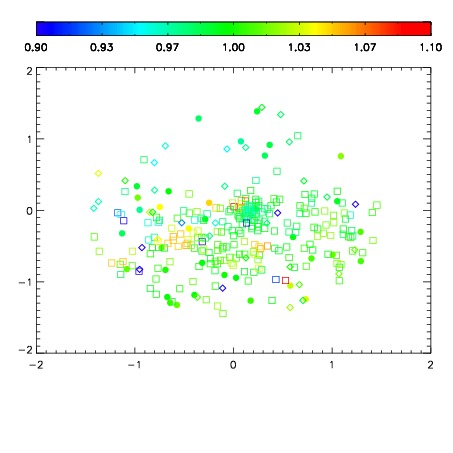
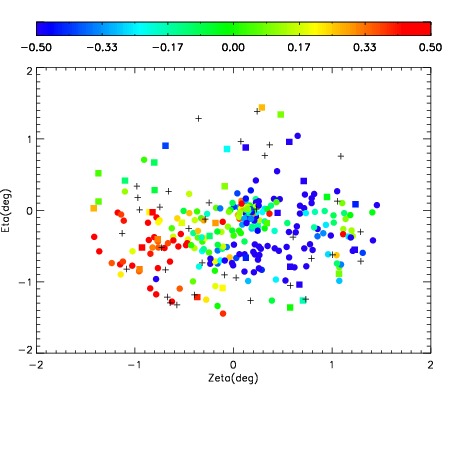
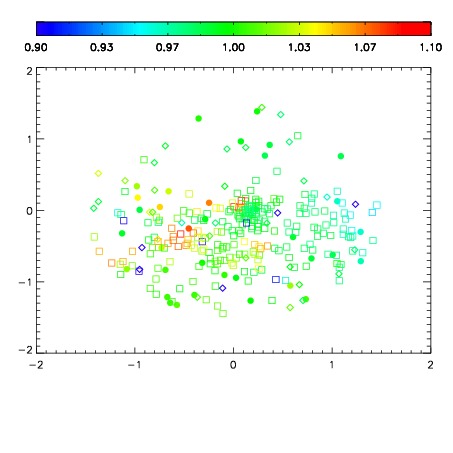
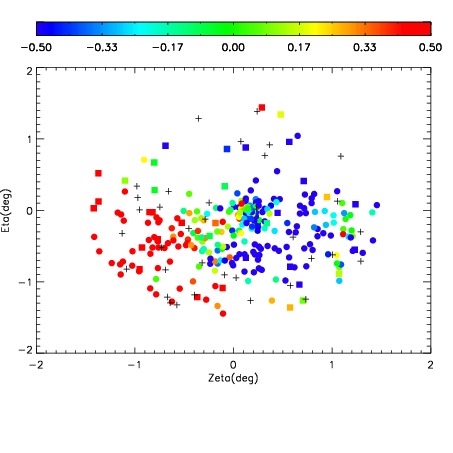
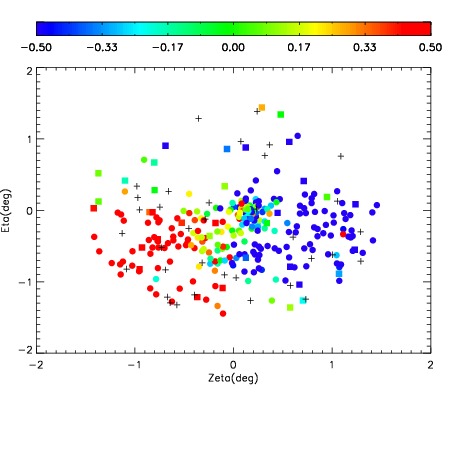
| Spatial sky 16325A emission deviations (filled: sky, open: star)
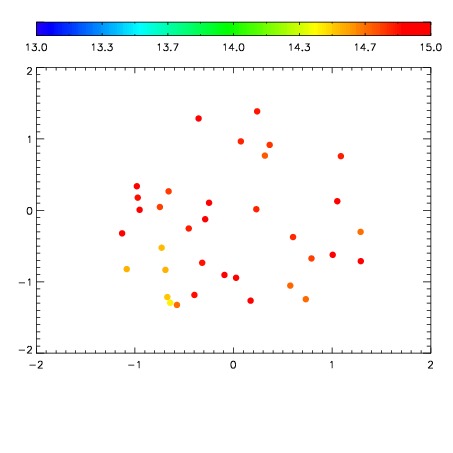
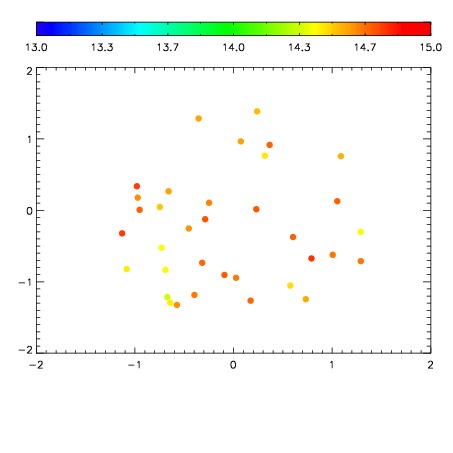
| Spatial sky continuum emission
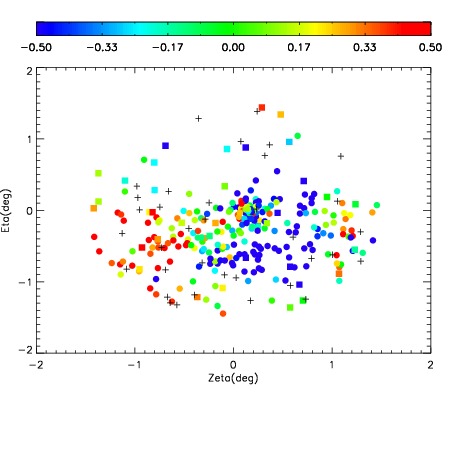
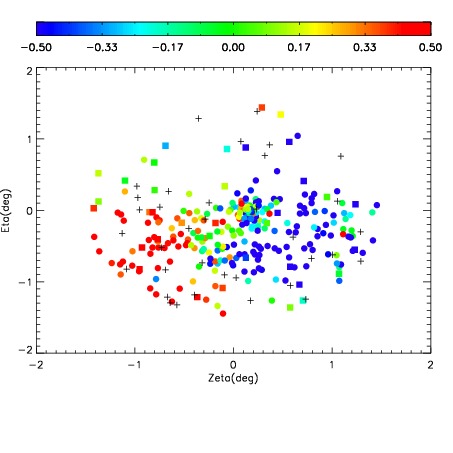
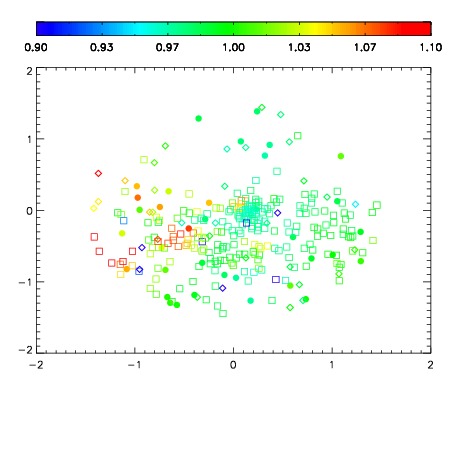
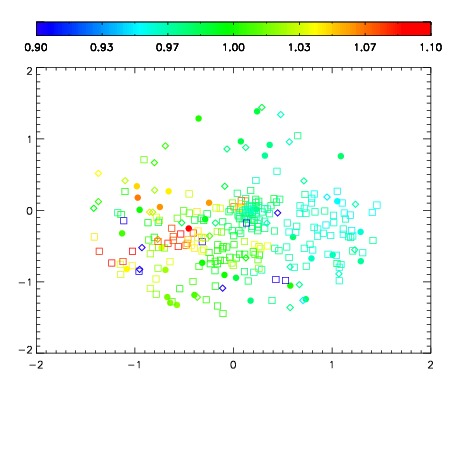
| Spatial sky telluric CO2 absorption deviations (filled: H < 10)
|
| 2600037
| 47
| | Red | Green | Blue
| | z | | 18.32
| | znorm | | 14.14
| | sky | 15.0 | 14.7 | 14.9
| | S/N | 8.0 | 15.5 | 18.1
| | S/N(c) | 7.0 | 14.6 | 16.4
| | SN(E/C) 0.72
|
| 
| 
| 
| 
| 
|
| 2600038
| 47
| | Red | Green | Blue
| | z | | 18.18
| | znorm | | 14.00
| | sky | 15.0 | 14.7 | 15.1
| | S/N | 7.8 | 15.0 | 17.2
| | S/N(c) | 6.8 | 14.1 | 15.8
| | SN(E/C) 0.83
|
| 
| 
| 
| 
| 
|
| 2600039
| 47
| | Red | Green | Blue
| | z | | 18.04
| | znorm | | 13.85
| | sky | 14.9 | 14.8 | 15.0
| | S/N | 6.8 | 14.0 | 16.8
| | S/N(c) | 6.0 | 13.0 | 15.2
| | SN(E/C) 0.80
|
| 
| 
| 
| 
| 
|
| 2600040
| 47
| | Red | Green | Blue
| | z | | 17.98
| | znorm | | 13.80
| | sky | 15.1 | 14.8 | 15.1
| | S/N | 6.5 | 13.5 | 15.0
| | S/N(c) | 5.6 | 12.3 | 13.5
| | SN(E/C) 0.85
|
| 
| 
| 
| 
| 
|
| 2600041
| 47
| | Red | Green | Blue
| | z | | 18.01
| | znorm | | 13.83
| | sky | 14.9 | 14.8 | 15.0
| | S/N | 6.0 | 11.9 | 13.7
| | S/N(c) | 5.1 | 11.1 | 12.3
| | SN(E/C) 0.82
|
| 
| 
| 
| 
| 
|
| 2600042
| 47
| | Red | Green | Blue
| | z | | 17.87
| | znorm | | 13.69
| | sky | 14.9 | 14.6 | 14.9
| | S/N | 4.1 | 9.5 | 10.7
| | S/N(c) | 3.5 | 8.5 | 9.6
| | SN(E/C) 0.84
|
| 
| 
| 
| 
| 
|
| 2600043
| 47
| | Red | Green | Blue
| | z | | 17.36
| | znorm | | 13.18
| | sky | 14.9 | 14.6 | 14.9
| | S/N | 2.9 | 7.6 | 7.7
| | S/N(c) | 2.5 | 6.8 | 6.9
| | SN(E/C) 0.88
|
| 
| 
| 
| 
| 
|
| 2600044
| 47
| | Red | Green | Blue
| | z | | 17.70
| | znorm | | 13.52
| | sky | 14.8 | 14.6 | 15.0
| | S/N | 3.5 | 8.3 | 8.9
| | S/N(c) | 2.9 | 7.3 | 7.8
| | SN(E/C) 0.87
|
| 
| 
| 
| 
| 
|