| Red | Green | Blue | |
| z | 17.64 | ||
| znorm | Inf | ||
| sky | -Inf | -Inf | -Inf |
| S/N | 9.8 | 21.8 | 24.3 |
| S/N(c) | 0.0 | 0.0 | 0.0 |
| SN(E/C) |
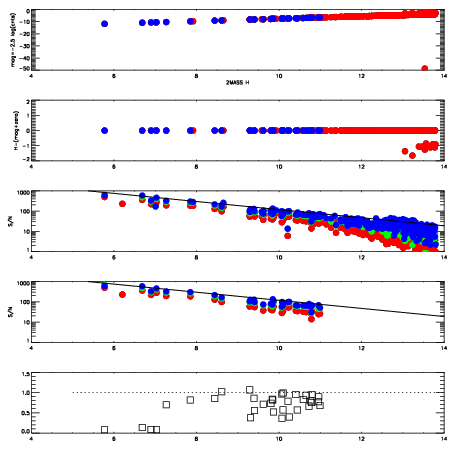
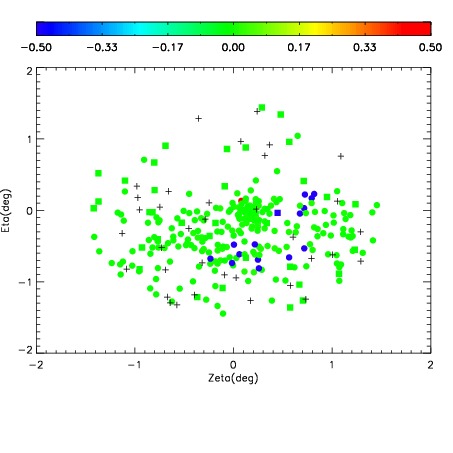
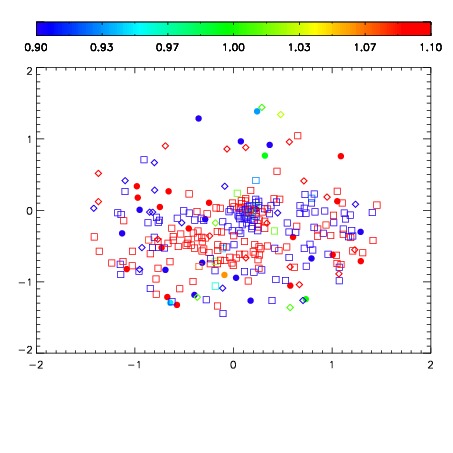
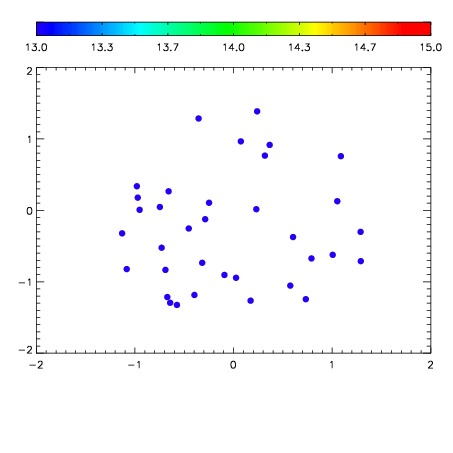

| Frame | Nreads | Zeropoints | Mag plots | Spatial mag deviation | Spatial sky 16325A emission deviations (filled: sky, open: star) | Spatial sky continuum emission | Spatial sky telluric CO2 absorption deviations (filled: H < 10) | |||||||||||||||||||||||
| 0 | 0 |
|
|
|
|
|
|
| IPAIR | NAME | SHIFT | NEWSHIFT | S/N | NAME | SHIFT | NEWSHIFT | S/N |
| 0 | 02600039 | 0.425013 | 0.00000 | 138.650 | 02600041 | 0.00361671 | 0.421396 | 137.970 |
| 1 | 02600038 | 0.422857 | 0.00215602 | 147.033 | 02600037 | 0.00000 | 0.425013 | 144.345 |
| 2 | 02600042 | 0.423735 | 0.00127801 | 136.528 | 02600044 | 0.00526894 | 0.419744 | 131.604 |
| 3 | 02600043 | 0.424831 | 0.000182003 | 121.254 | 02600040 | 0.00546119 | 0.419552 | 128.435 |