| Red | Green | Blue | |
| z | 17.64 | ||
| znorm | Inf | ||
| sky | -NaN | -Inf | -Inf |
| S/N | 23.9 | 40.5 | 46.8 |
| S/N(c) | 0.0 | 0.0 | 0.0 |
| SN(E/C) |
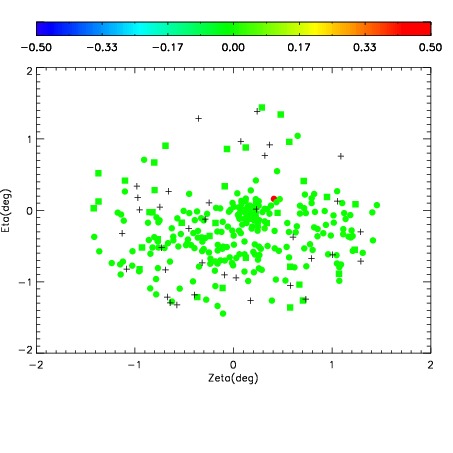
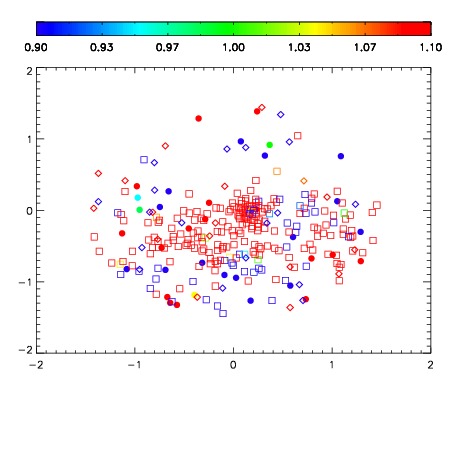
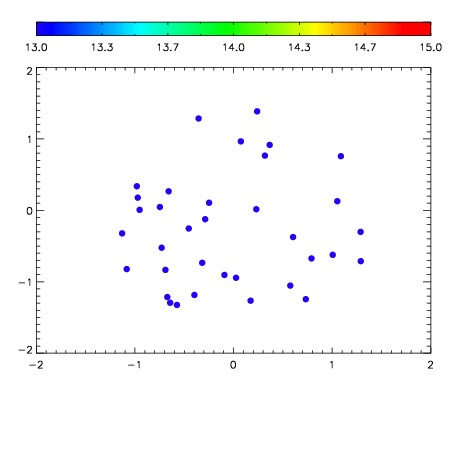

| Frame | Nreads | Zeropoints | Mag plots | Spatial mag deviation | Spatial sky 16325A emission deviations (filled: sky, open: star) | Spatial sky continuum emission | Spatial sky telluric CO2 absorption deviations (filled: H < 10) | |||||||||||||||||||||||
| 0 | 0 |
|
|
|
|
|
|
| IPAIR | NAME | SHIFT | NEWSHIFT | S/N | NAME | SHIFT | NEWSHIFT | S/N |
| 0 | 02870033 | 0.413146 | 0.00000 | 176.038 | 02870031 | 0.00291169 | 0.410234 | 186.502 |
| 1 | 02870028 | 0.410030 | 0.00311598 | 199.110 | 02870030 | 0.00422769 | 0.408918 | 191.220 |
| 2 | 02870029 | 0.411587 | 0.00155899 | 195.425 | 02870027 | 0.00000 | 0.413146 | 188.381 |
| 3 | 02870032 | 0.411410 | 0.00173599 | 180.093 | 02870034 | 0.00453419 | 0.408612 | 186.558 |