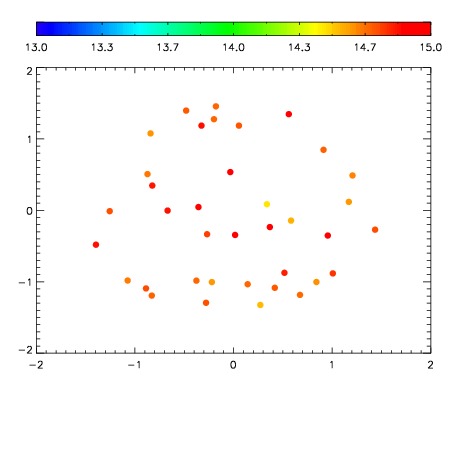
| Frame | Nreads | Zeropoints | Mag plots
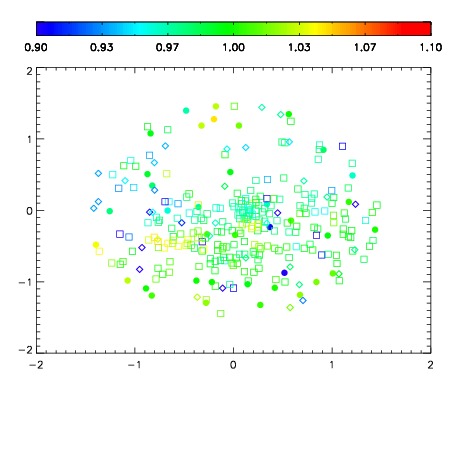
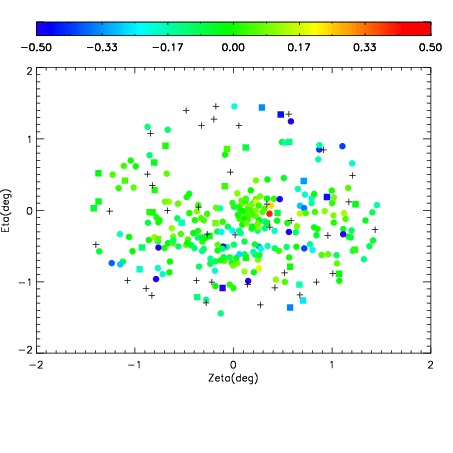
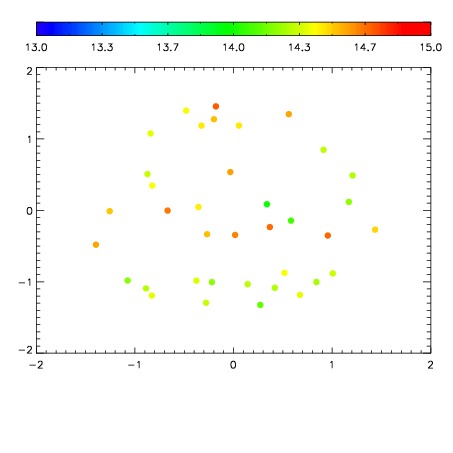
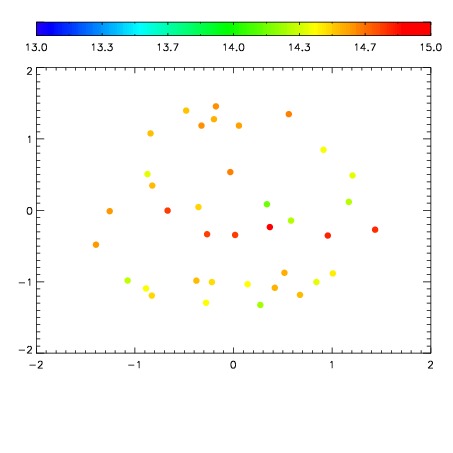
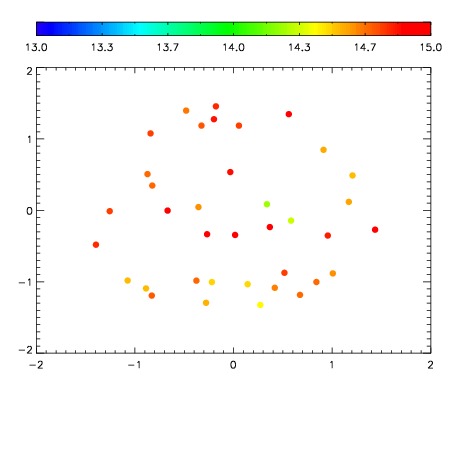
| Spatial mag deviation
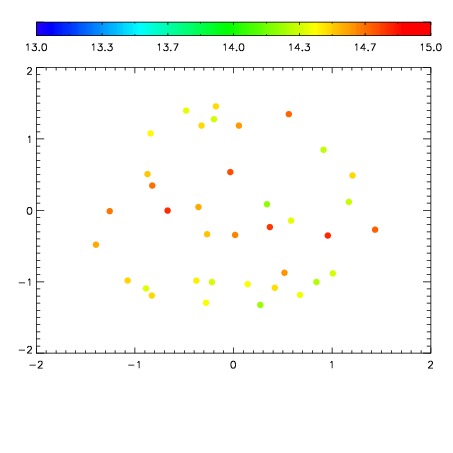
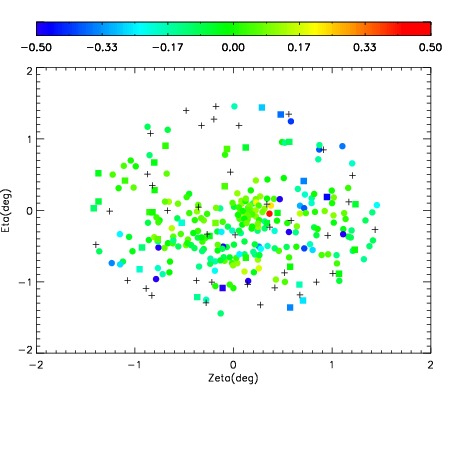
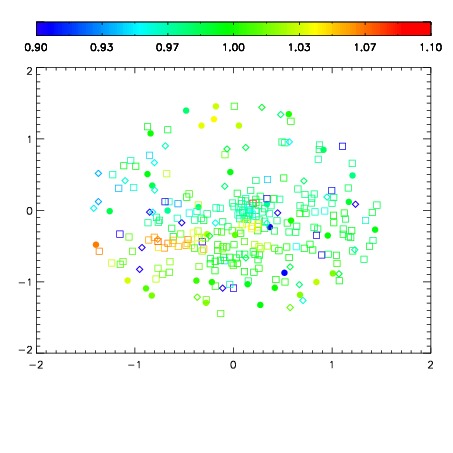
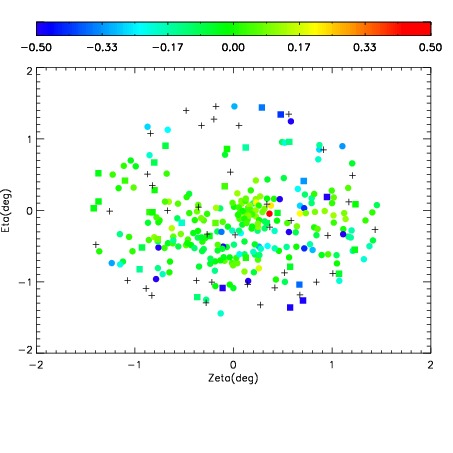
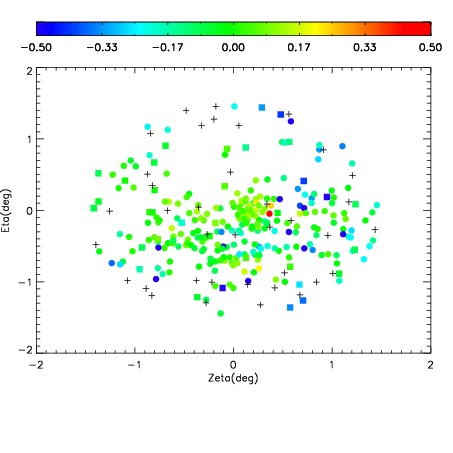
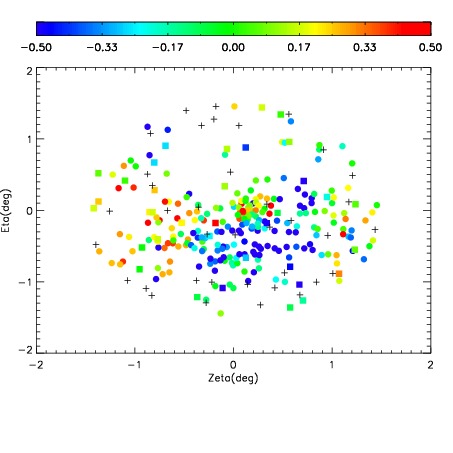
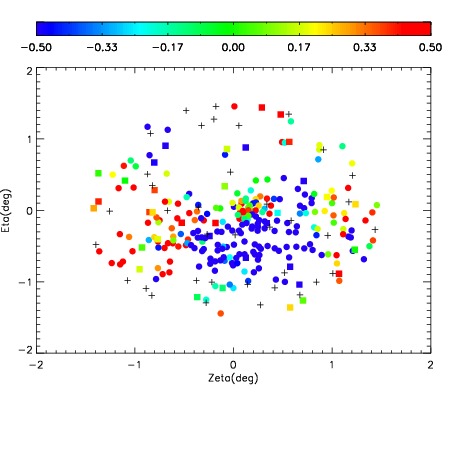
| Spatial sky 16325A emission deviations (filled: sky, open: star)
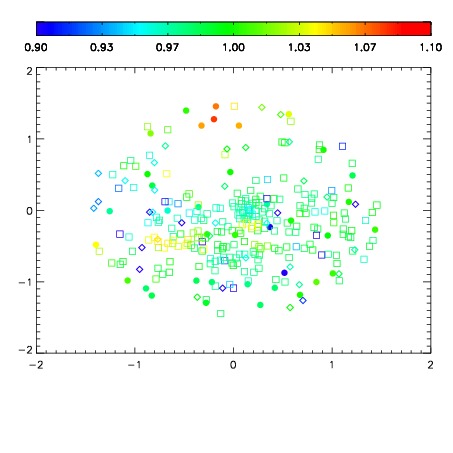
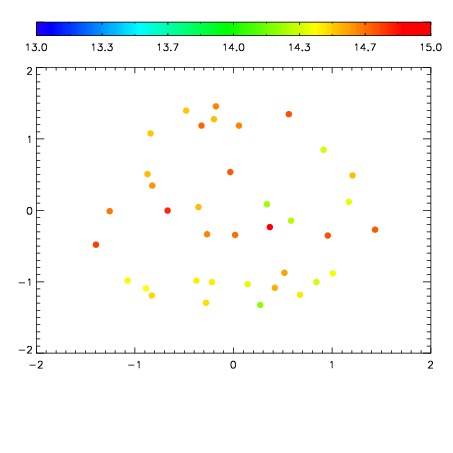
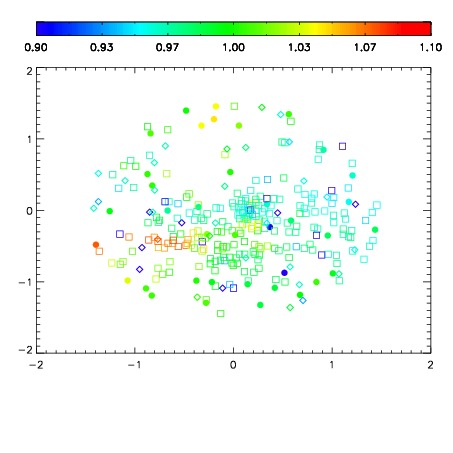
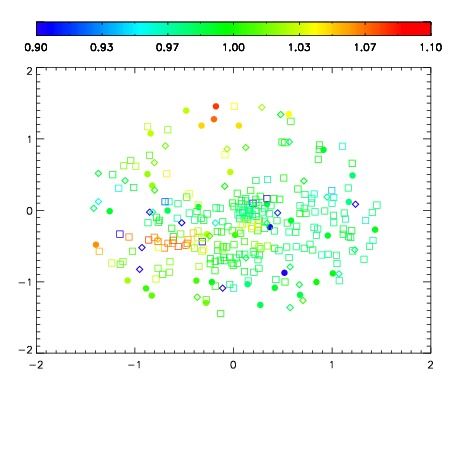
| Spatial sky continuum emission
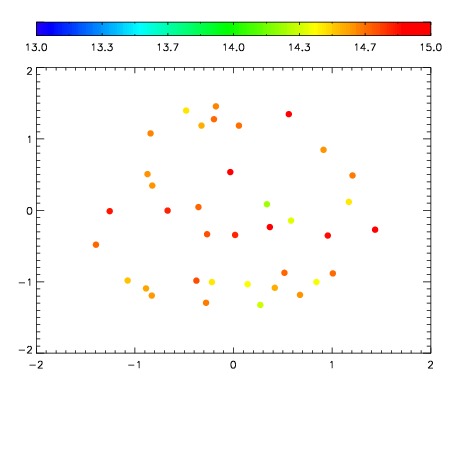
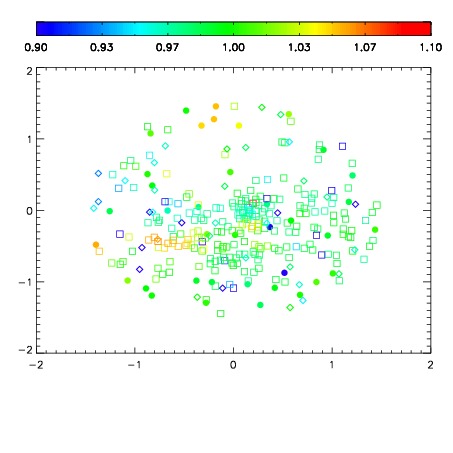
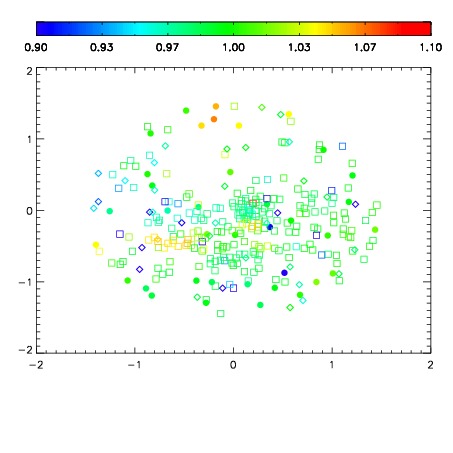
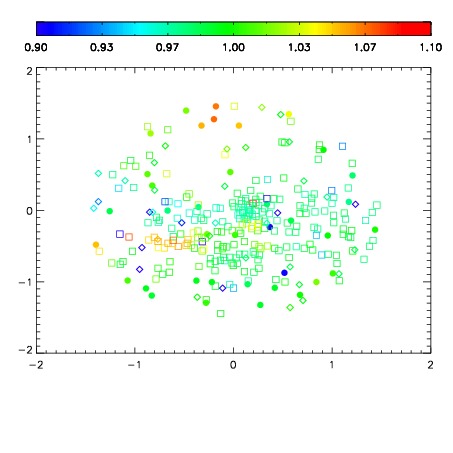
| Spatial sky telluric CO2 absorption deviations (filled: H < 10)
|
| 2610028
| 47
| | Red | Green | Blue
| | z | | 18.98
| | znorm | | 14.80
| | sky | 14.8 | 14.5 | 14.4
| | S/N | 14.6 | 25.0 | 27.0
| | S/N(c) | 13.0 | 23.2 | 25.8
| | SN(E/C) 0.55
|
| 
| 
| 
| 
| 
|
| 2610029
| 47
| | Red | Green | Blue
| | z | | 19.13
| | znorm | | 14.95
| | sky | 14.8 | 14.6 | 14.6
| | S/N | 15.9 | 26.8 | 29.2
| | S/N(c) | 14.2 | 24.7 | 27.6
| | SN(E/C) 0.56
|
| 
| 
| 
| 
| 
|
| 2610030
| 47
| | Red | Green | Blue
| | z | | 19.12
| | znorm | | 14.94
| | sky | 14.6 | 14.5 | 14.6
| | S/N | 15.9 | 26.7 | 29.1
| | S/N(c) | 14.1 | 24.6 | 27.5
| | SN(E/C) 0.61
|
| 
| 
| 
| 
| 
|
| 2610031
| 47
| | Red | Green | Blue
| | z | | 19.24
| | znorm | | 15.06
| | sky | 14.6 | 14.4 | 14.5
| | S/N | 17.2 | 28.5 | 31.1
| | S/N(c) | 15.5 | 26.4 | 29.3
| | SN(E/C) 0.53
|
| 
| 
| 
| 
| 
|
| 2610032
| 47
| | Red | Green | Blue
| | z | | 19.13
| | znorm | | 14.95
| | sky | 14.6 | 14.5 | 14.5
| | S/N | 15.4 | 26.3 | 28.7
| | S/N(c) | 13.7 | 24.0 | 27.1
| | SN(E/C) 0.54
|
| 
| 
| 
| 
| 
|
| 2610033
| 47
| | Red | Green | Blue
| | z | | 19.09
| | znorm | | 14.91
| | sky | 14.8 | 14.7 | 14.6
| | S/N | 15.0 | 25.9 | 28.1
| | S/N(c) | 13.5 | 23.9 | 26.6
| | SN(E/C) 0.56
|
| 
| 
| 
| 
| 
|
| 2610034
| 47
| | Red | Green | Blue
| | z | | 18.36
| | znorm | | 14.18
| | sky | 14.6 | 14.7 | 14.7
| | S/N | 9.1 | 17.7 | 18.7
| | S/N(c) | 8.0 | 16.1 | 17.6
| | SN(E/C) 0.68
|
| 
| 
| 
| 
| 
|
| 2610035
| 47
| | Red | Green | Blue
| | z | | 17.87
| | znorm | | 13.69
| | sky | 14.8 | 14.8 | 14.8
| | S/N | 5.1 | 10.6 | 14.6
| | S/N(c) | 4.3 | 9.7 | 13.7
| | SN(E/C) 0.84
|
| 
| 
| 
| 
| 
|