| Red | Green | Blue | |
| z | 17.64 | ||
| znorm | Inf | ||
| sky | -Inf | -NaN | -Inf |
| S/N | 24.5 | 43.4 | 48.4 |
| S/N(c) | 0.0 | 0.0 | 0.0 |
| SN(E/C) |
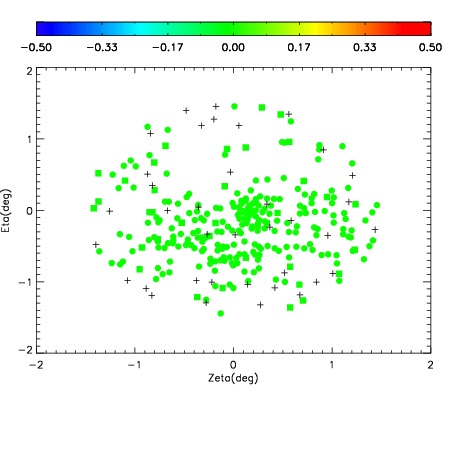
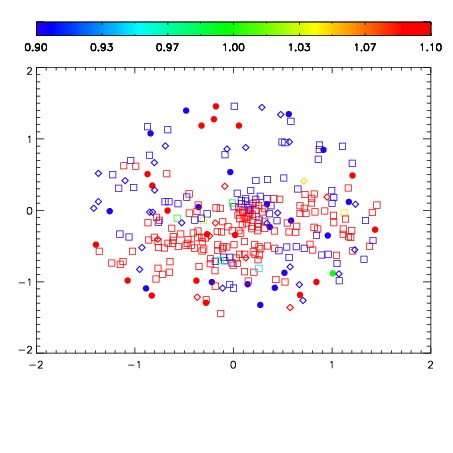
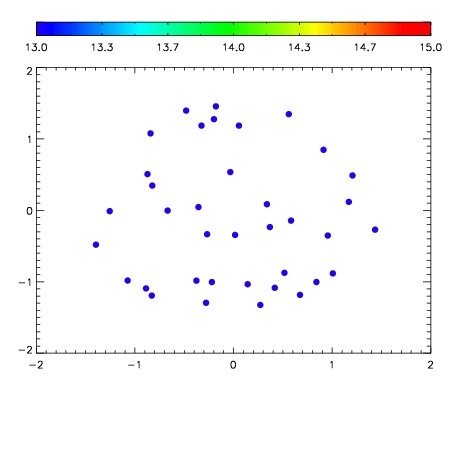

| Frame | Nreads | Zeropoints | Mag plots | Spatial mag deviation | Spatial sky 16325A emission deviations (filled: sky, open: star) | Spatial sky continuum emission | Spatial sky telluric CO2 absorption deviations (filled: H < 10) | |||||||||||||||||||||||
| 0 | 0 |
|
|
|
|
|
|
| IPAIR | NAME | SHIFT | NEWSHIFT | S/N | NAME | SHIFT | NEWSHIFT | S/N |
| 0 | 02610034 | 0.419482 | 0.00000 | 171.730 | 02610035 | -0.00316303 | 0.422645 | 157.434 |
| 1 | 02610030 | 0.417058 | 0.00242400 | 203.494 | 02610031 | -0.00151341 | 0.420995 | 220.581 |
| 2 | 02610029 | 0.414322 | 0.00516000 | 203.476 | 02610032 | -0.00278802 | 0.422270 | 203.655 |
| 3 | 02610033 | 0.416193 | 0.00328898 | 199.952 | 02610028 | 0.00000 | 0.419482 | 184.779 |