| Red | Green | Blue | |
| z | 17.64 | ||
| znorm | Inf | ||
| sky | -Inf | -Inf | -Inf |
| S/N | 29.3 | 50.0 | 56.0 |
| S/N(c) | 0.0 | 0.0 | 0.0 |
| SN(E/C) |

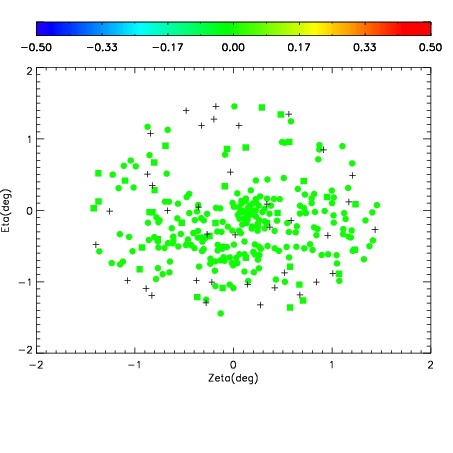
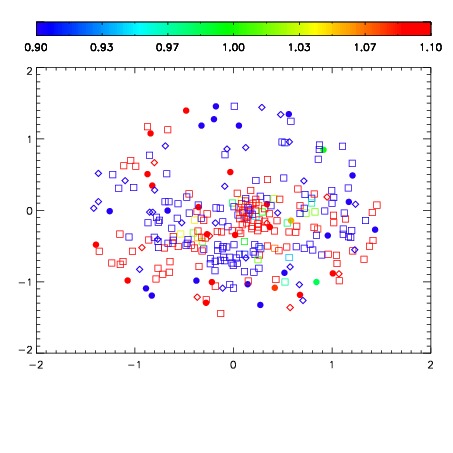
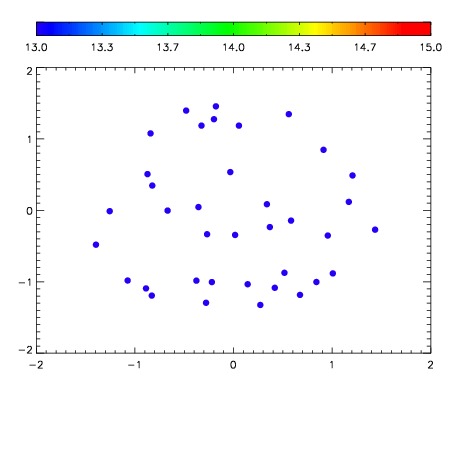

| Frame | Nreads | Zeropoints | Mag plots | Spatial mag deviation | Spatial sky 16325A emission deviations (filled: sky, open: star) | Spatial sky continuum emission | Spatial sky telluric CO2 absorption deviations (filled: H < 10) | |||||||||||||||||||||||
| 0 | 0 |
|
|
|
|
|
|
| IPAIR | NAME | SHIFT | NEWSHIFT | S/N | NAME | SHIFT | NEWSHIFT | S/N |
| 0 | 02830025 | 0.414048 | 0.00000 | 235.156 | 02830019 | 0.00000 | 0.414048 | 232.755 |
| 1 | 02830021 | 0.413292 | 0.000755996 | 235.602 | 02830023 | -0.00201473 | 0.416063 | 234.719 |
| 2 | 02830020 | 0.412919 | 0.00112897 | 235.352 | 02830026 | 0.00288287 | 0.411165 | 234.615 |
| 3 | 02830024 | 0.413225 | 0.000822991 | 235.240 | 02830022 | 0.000988443 | 0.413060 | 234.052 |