| Frame | Nreads | Zeropoints | Mag plots
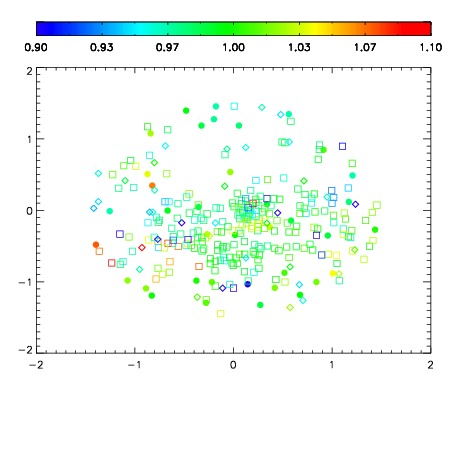
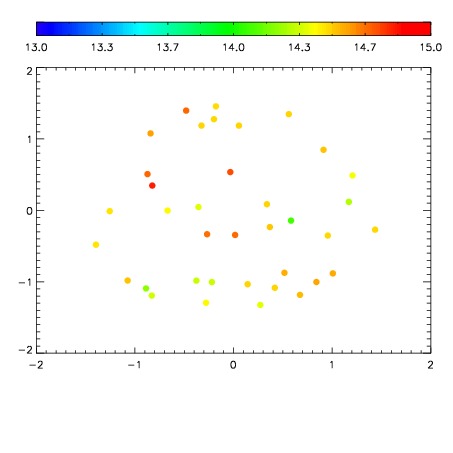
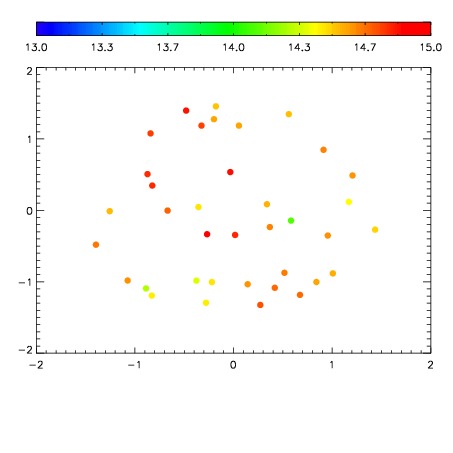
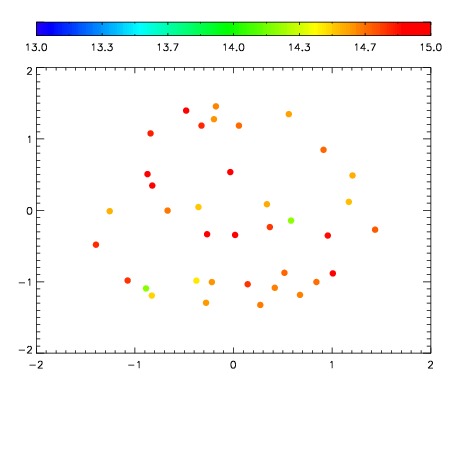
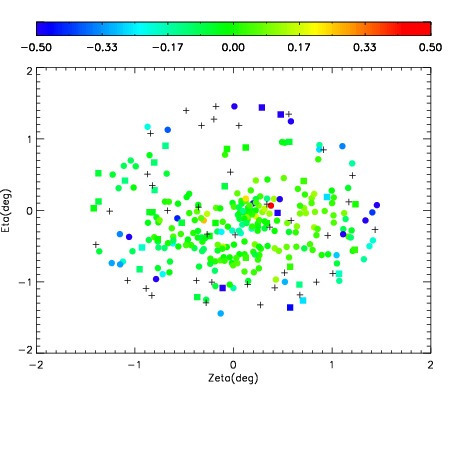
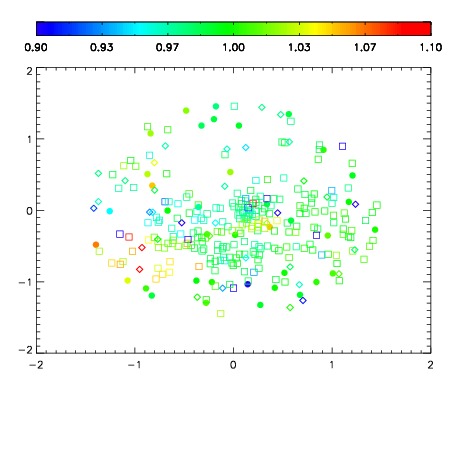
| Spatial mag deviation
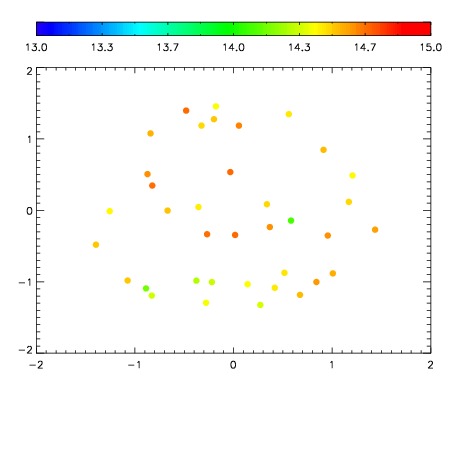
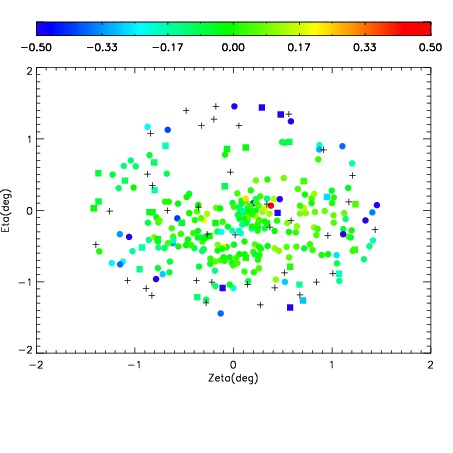
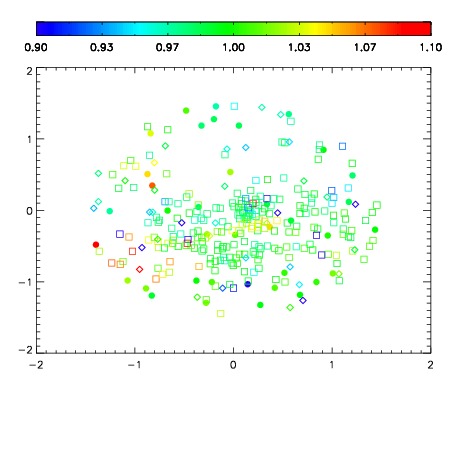
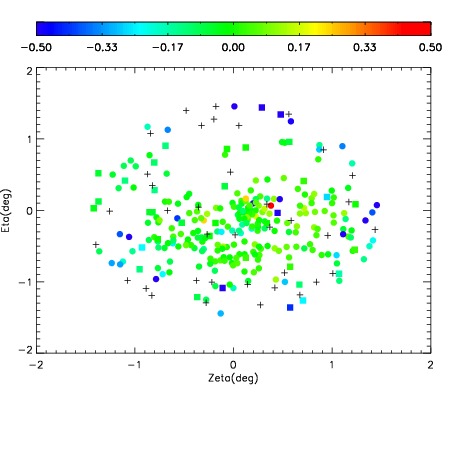
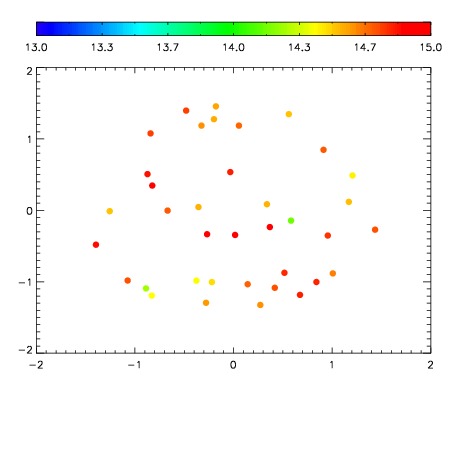
| Spatial sky 16325A emission deviations (filled: sky, open: star)
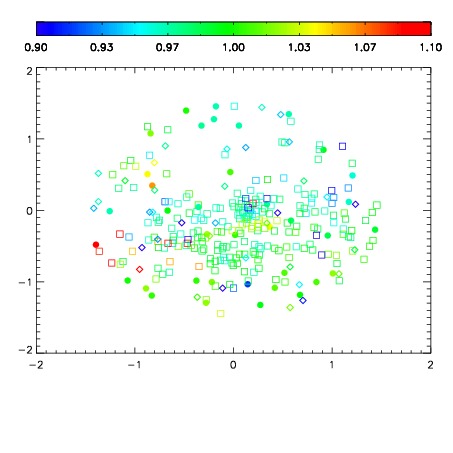
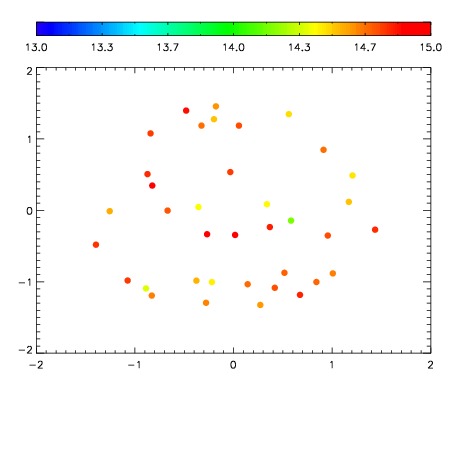
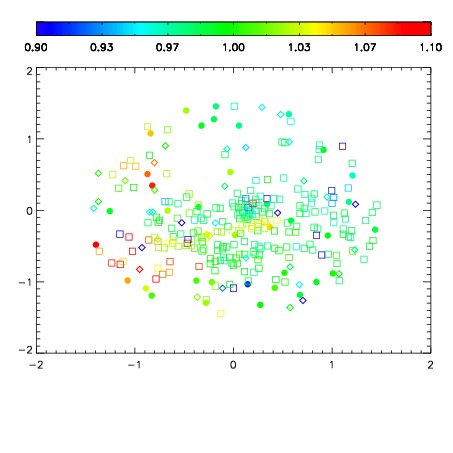
| Spatial sky continuum emission
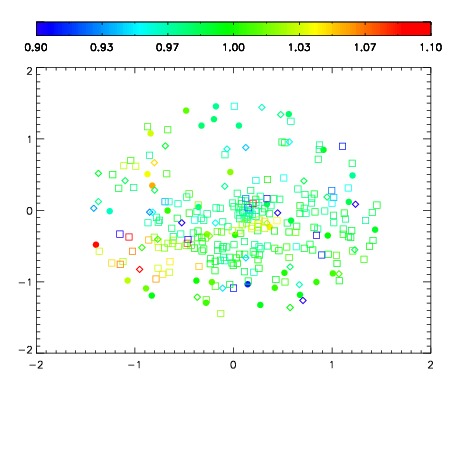
| Spatial sky telluric CO2 absorption deviations (filled: H < 10)
|
| 2860027
| 47
| | Red | Green | Blue
| | z | | 19.24
| | znorm | | 15.06
| | sky | 14.7 | 14.5 | 14.4
| | S/N | 17.1 | 27.5 | 29.2
| | S/N(c) | 14.9 | 24.9 | 27.6
| | SN(E/C) 0.60
|
| 
| 
| 
| 
| 
|
| 2860028
| 47
| | Red | Green | Blue
| | z | | 19.26
| | znorm | | 15.08
| | sky | 14.7 | 14.5 | 14.8
| | S/N | 16.9 | 27.5 | 29.5
| | S/N(c) | 14.9 | 25.1 | 27.6
| | SN(E/C) 0.55
|
| 
| 
| 
| 
| 
|
| 2860029
| 47
| | Red | Green | Blue
| | z | | 19.25
| | znorm | | 15.07
| | sky | 14.8 | 14.6 | 14.8
| | S/N | 16.6 | 27.8 | 29.4
| | S/N(c) | 14.8 | 25.3 | 27.7
| | SN(E/C) 0.54
|
| 
| 
| 
| 
| 
|
| 2860030
| 47
| | Red | Green | Blue
| | z | | 19.26
| | znorm | | 15.08
| | sky | 14.9 | 14.7 | 14.8
| | S/N | 17.1 | 28.4 | 30.4
| | S/N(c) | 15.3 | 26.0 | 28.7
| | SN(E/C) 0.55
|
| 
| 
| 
| 
| 
|
| 2860031
| 47
| | Red | Green | Blue
| | z | | 19.28
| | znorm | | 15.10
| | sky | 14.7 | 14.7 | 14.8
| | S/N | 17.3 | 28.4 | 30.6
| | S/N(c) | 15.4 | 26.0 | 28.8
| | SN(E/C) 0.51
|
| 
| 
| 
| 
| 
|
| 2860032
| 47
| | Red | Green | Blue
| | z | | 19.27
| | znorm | | 15.09
| | sky | 14.9 | 14.8 | 14.9
| | S/N | 17.3 | 28.5 | 30.5
| | S/N(c) | 15.3 | 25.9 | 28.7
| | SN(E/C) 0.56
|
| 
| 
| 
| 
| 
|
| 2860033
| 47
| | Red | Green | Blue
| | z | | 19.25
| | znorm | | 15.07
| | sky | 14.9 | 14.7 | 14.8
| | S/N | 17.4 | 28.6 | 30.5
| | S/N(c) | 15.5 | 26.1 | 29.0
| | SN(E/C) 0.52
|
| 
| 
| 
| 
| 
|
| 2860034
| 47
| | Red | Green | Blue
| | z | | 19.25
| | znorm | | 15.07
| | sky | 14.8 | 14.7 | 14.9
| | S/N | 17.2 | 28.6 | 30.6
| | S/N(c) | 15.3 | 26.1 | 28.7
| | SN(E/C) 0.54
|
| 
| 
| 
| 
| 
|