| Red | Green | Blue | |
| z | 17.64 | ||
| znorm | Inf | ||
| sky | -Inf | -Inf | -Inf |
| S/N | 29.4 | 49.7 | 54.9 |
| S/N(c) | 0.0 | 0.0 | 0.0 |
| SN(E/C) |
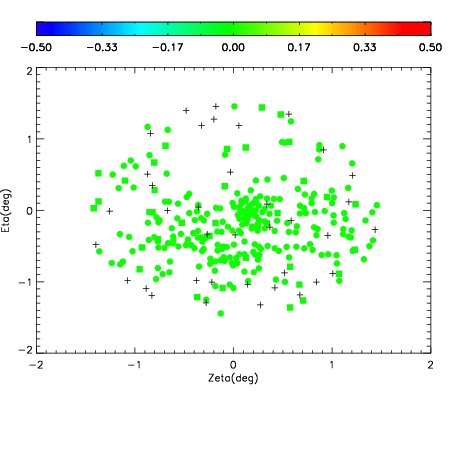

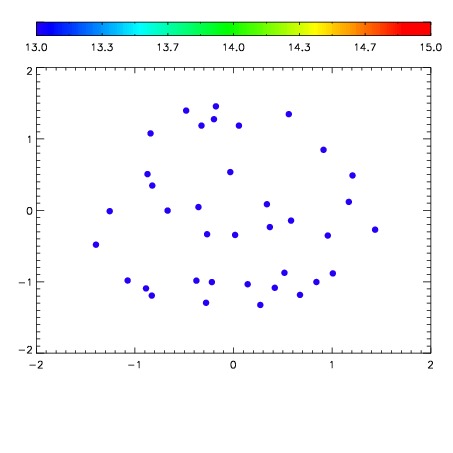

| Frame | Nreads | Zeropoints | Mag plots | Spatial mag deviation | Spatial sky 16325A emission deviations (filled: sky, open: star) | Spatial sky continuum emission | Spatial sky telluric CO2 absorption deviations (filled: H < 10) | |||||||||||||||||||||||
| 0 | 0 |
|
|
|
|
|
|
| IPAIR | NAME | SHIFT | NEWSHIFT | S/N | NAME | SHIFT | NEWSHIFT | S/N |
| 0 | 02860029 | 0.416492 | 0.00000 | 229.136 | 02860034 | 0.00535864 | 0.411133 | 228.886 |
| 1 | 02860032 | 0.414608 | 0.00188398 | 231.010 | 02860031 | 0.000389991 | 0.416102 | 231.416 |
| 2 | 02860028 | 0.415413 | 0.00107899 | 230.632 | 02860030 | 0.00456496 | 0.411927 | 230.397 |
| 3 | 02860033 | 0.416480 | 1.19805e-05 | 229.838 | 02860027 | 0.00000 | 0.416492 | 230.081 |