| Red | Green | Blue | |
| z | 17.64 | ||
| znorm | Inf | ||
| sky | -Inf | -Inf | -Inf |
| S/N | 27.1 | 47.8 | 49.2 |
| S/N(c) | 0.0 | 0.0 | 0.0 |
| SN(E/C) |
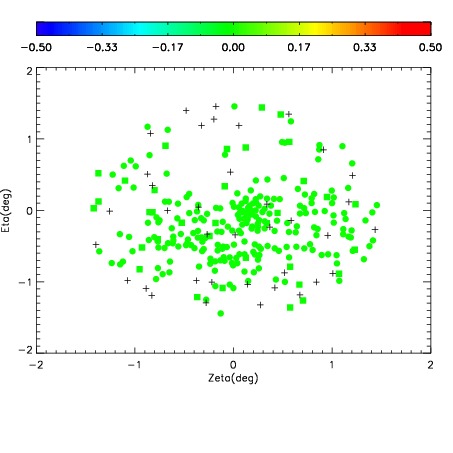
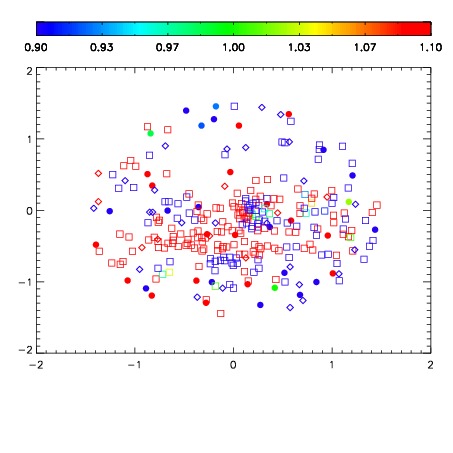
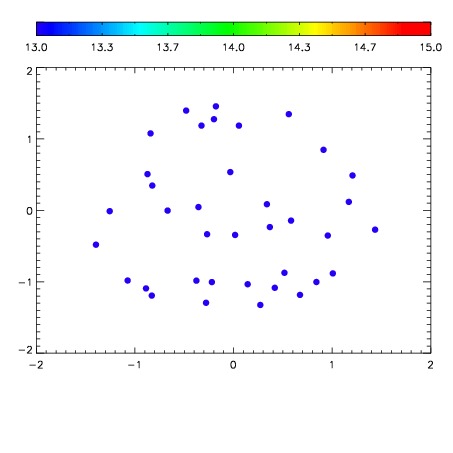

| Frame | Nreads | Zeropoints | Mag plots | Spatial mag deviation | Spatial sky 16325A emission deviations (filled: sky, open: star) | Spatial sky continuum emission | Spatial sky telluric CO2 absorption deviations (filled: H < 10) | |||||||||||||||||||||||
| 0 | 0 |
|
|
|
|
|
|
| IPAIR | NAME | SHIFT | NEWSHIFT | S/N | NAME | SHIFT | NEWSHIFT | S/N |
| 0 | 02880014 | 0.414884 | 0.00000 | 217.414 | 02880012 | 0.00000 | 0.414884 | 221.131 |
| 1 | 02880013 | 0.413996 | 0.000887990 | 214.315 | 02880019 | 0.00129525 | 0.413589 | 216.579 |
| 2 | 02880018 | 0.412565 | 0.00231901 | 212.073 | 02880015 | 0.00108110 | 0.413803 | 208.844 |
| 3 | 02880017 | 0.411765 | 0.00311899 | 209.527 | 02880016 | 0.000723625 | 0.414160 | 208.172 |