| Frame | Nreads | Zeropoints | Mag plots
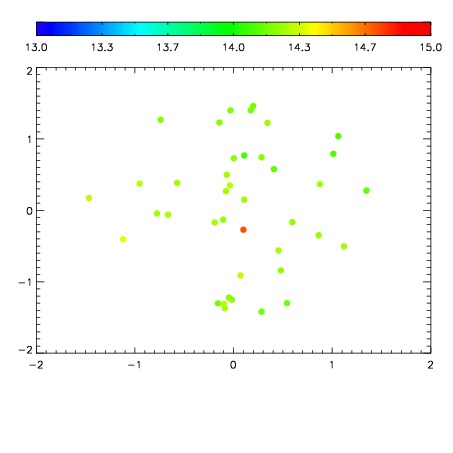
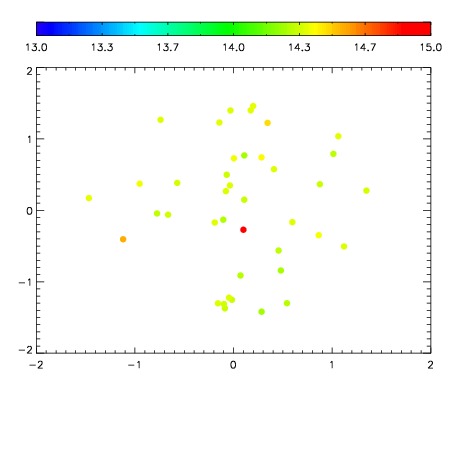
| Spatial mag deviation
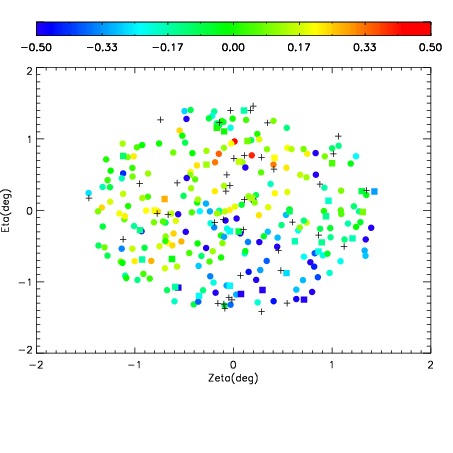
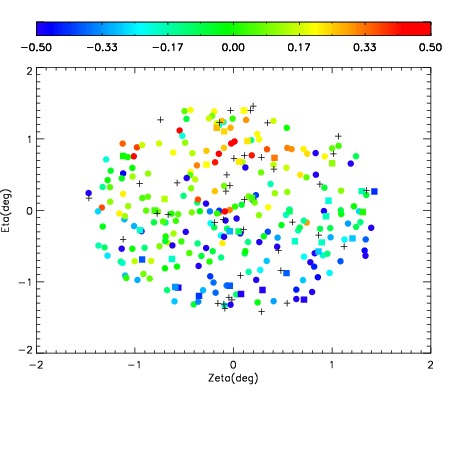
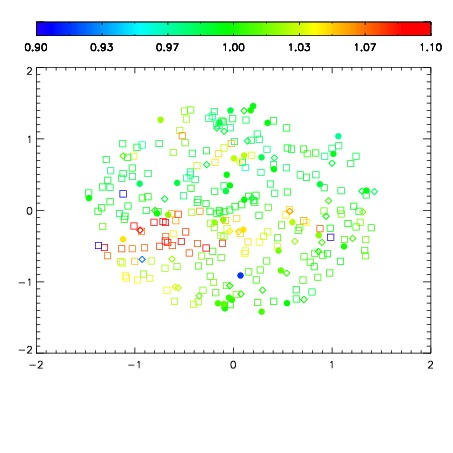
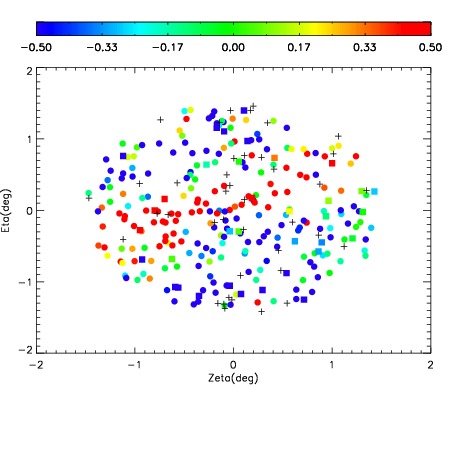
| Spatial sky 16325A emission deviations (filled: sky, open: star)
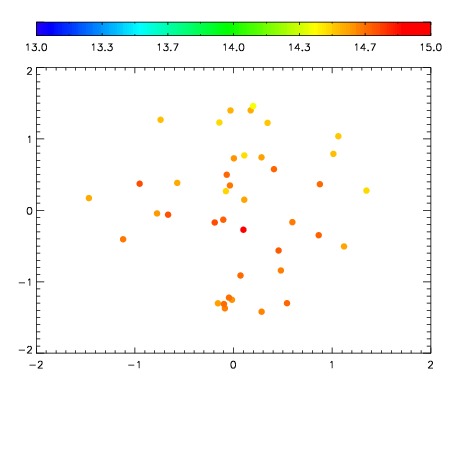
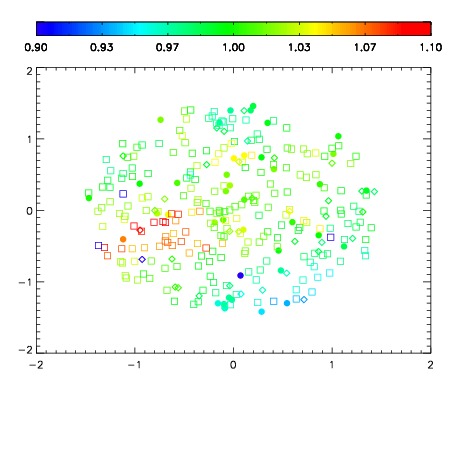
| Spatial sky continuum emission
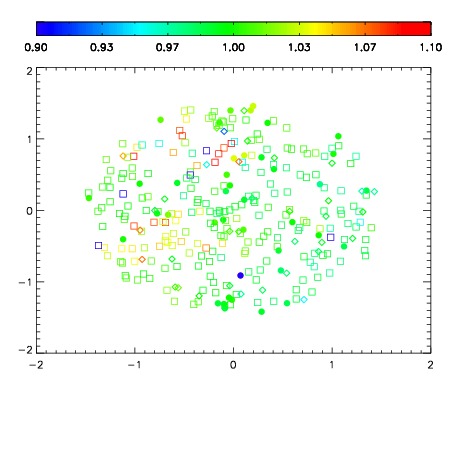
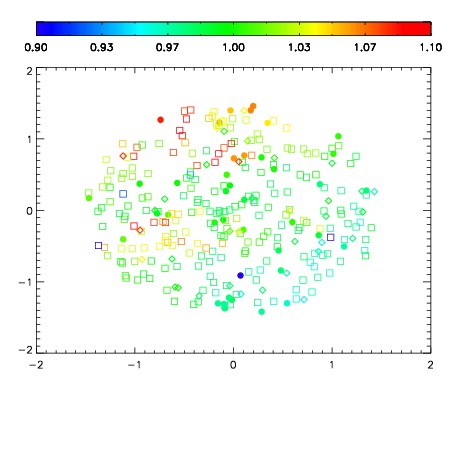
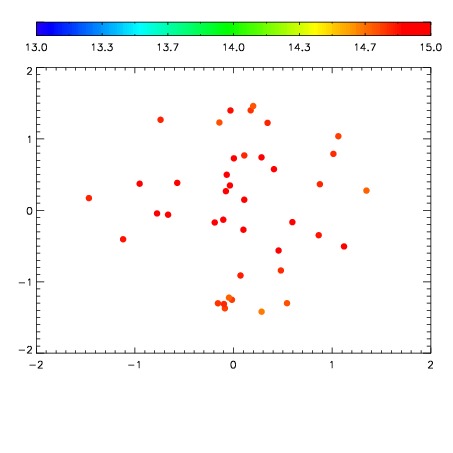
| Spatial sky telluric CO2 absorption deviations (filled: H < 10)
|
| 2530032
| 47
| | Red | Green | Blue
| | z | | 17.45
| | znorm | | 13.27
| | sky | 14.5 | 14.2 | 14.3
| | S/N | 4.7 | 9.4 | 11.6
| | S/N(c) | 4.1 | 8.9 | 11.0
| | SN(E/C) 0.94
|
| 
| 
| 
| 
| 
|
| 2530033
| 47
| | Red | Green | Blue
| | z | | 16.68
| | znorm | | 12.50
| | sky | 14.4 | 14.4 | 14.4
| | S/N | 2.3 | 5.2 | 6.0
| | S/N(c) | 2.0 | 5.1 | 5.3
| | SN(E/C) 0.98
|
| 
| 
| 
| 
| 
|
| 2530034
| 47
| | Red | Green | Blue
| | z | | 14.82
| | znorm | | 10.64
| | sky | 14.7 | 14.6 | 15.0
| | S/N | 0.3 | 1.5 | 1.3
| | S/N(c) | 0.3 | 1.5 | 1.3
| | SN(E/C) 0.96
|
| 
| 
| 
| 
| 
|
| 2530035
| 47
| | Red | Green | Blue
| | z | | 15.49
| | znorm | | 11.31
| | sky | 14.7 | 14.8 | 15.0
| | S/N | 1.6 | 3.6 | 4.6
| | S/N(c) | 1.5 | 3.6 | 4.2
| | SN(E/C) 0.90
|
| 
| 
| 
| 
| 
|