| Red | Green | Blue | |
| z | 17.65 | ||
| znorm | Inf | ||
| sky | -Inf | -Inf | -Inf |
| S/N | 2.9 | 6.3 | 7.0 |
| S/N(c) | 0.0 | 0.0 | 0.0 |
| SN(E/C) |
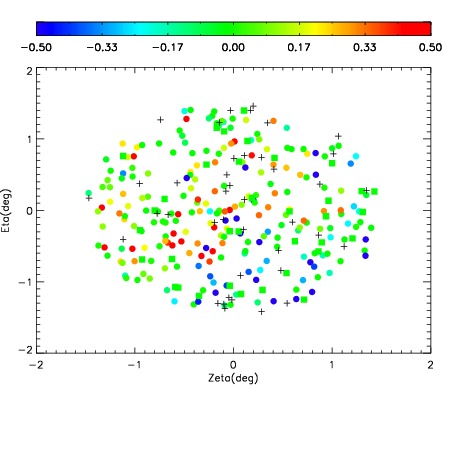
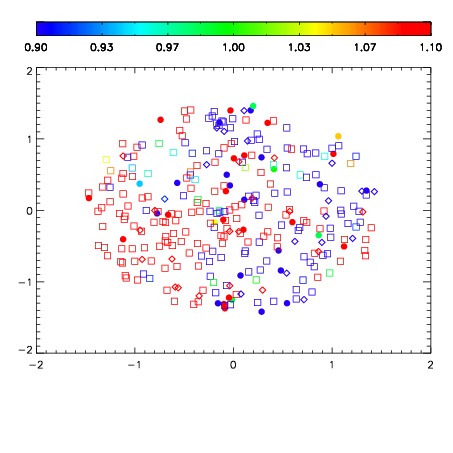
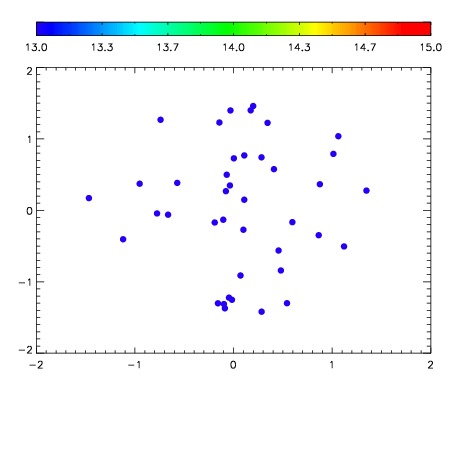

| Frame | Nreads | Zeropoints | Mag plots | Spatial mag deviation | Spatial sky 16325A emission deviations (filled: sky, open: star) | Spatial sky continuum emission | Spatial sky telluric CO2 absorption deviations (filled: H < 10) | |||||||||||||||||||||||
| 0 | 0 |
|
|
|
|
|
|
| IPAIR | NAME | SHIFT | NEWSHIFT | S/N | NAME | SHIFT | NEWSHIFT | S/N |
| 0 | 02530034 | 0.419602 | 0.00000 | 20.5717 | 02530035 | 0.00426525 | 0.415337 | 26.4975 |
| 1 | 02530033 | 0.416734 | 0.00286800 | 72.1182 | 02530032 | 0.00000 | 0.419602 | 98.4710 |