| Red | Green | Blue | |
| z | 17.64 | ||
| znorm | Inf | ||
| sky | -Inf | -Inf | -Inf |
| S/N | 25.9 | 44.5 | 54.2 |
| S/N(c) | 0.0 | 0.0 | 0.0 |
| SN(E/C) |
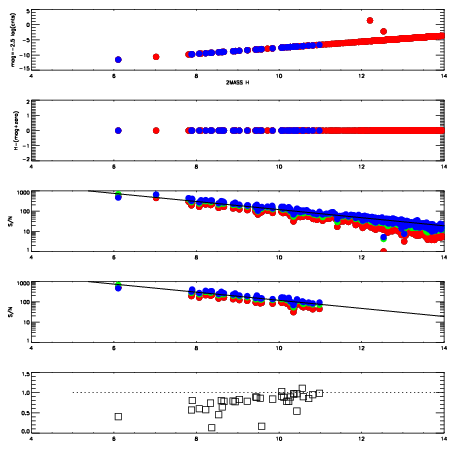
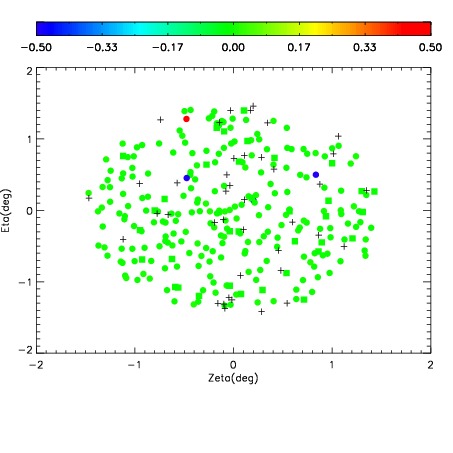
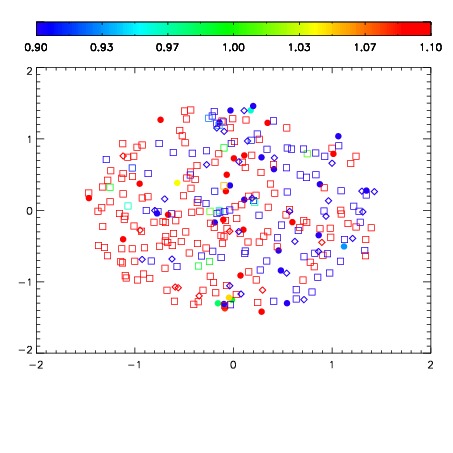
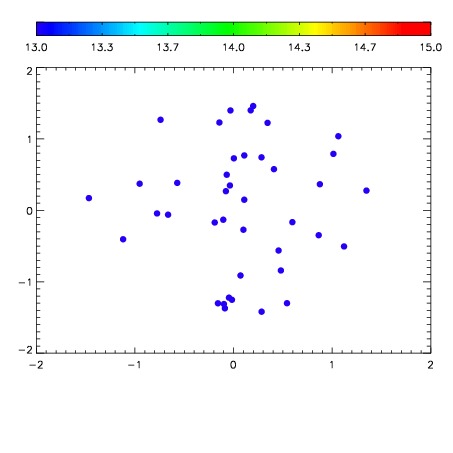

| Frame | Nreads | Zeropoints | Mag plots | Spatial mag deviation | Spatial sky 16325A emission deviations (filled: sky, open: star) | Spatial sky continuum emission | Spatial sky telluric CO2 absorption deviations (filled: H < 10) | |||||||||||||||||||||||
| 0 | 0 |
|
|
|
|
|
|
| IPAIR | NAME | SHIFT | NEWSHIFT | S/N | NAME | SHIFT | NEWSHIFT | S/N |
| 0 | 02610071 | 0.431705 | 0.00000 | 199.825 | 02610072 | 0.00479817 | 0.426907 | 193.412 |
| 1 | 02610067 | 0.428680 | 0.00302500 | 201.688 | 02610069 | -0.000615484 | 0.432320 | 204.691 |
| 2 | 02610066 | 0.426947 | 0.00475800 | 201.245 | 02610065 | 0.00000 | 0.431705 | 195.727 |
| 3 | 02610070 | 0.428598 | 0.00310701 | 195.576 | 02610068 | 0.00249714 | 0.429208 | 188.329 |