| Red | Green | Blue | |
| z | 17.64 | ||
| znorm | Inf | ||
| sky | -Inf | -Inf | -Inf |
| S/N | 21.0 | 41.1 | 51.0 |
| S/N(c) | 0.0 | 0.0 | 0.0 |
| SN(E/C) |
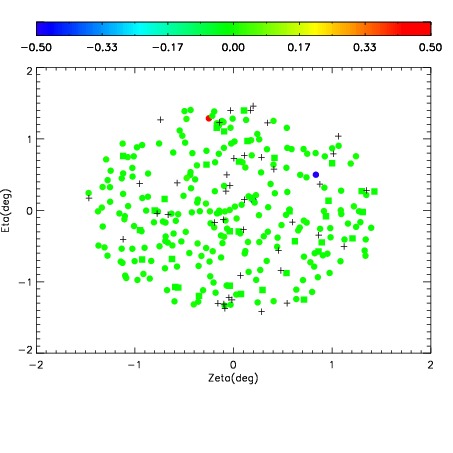
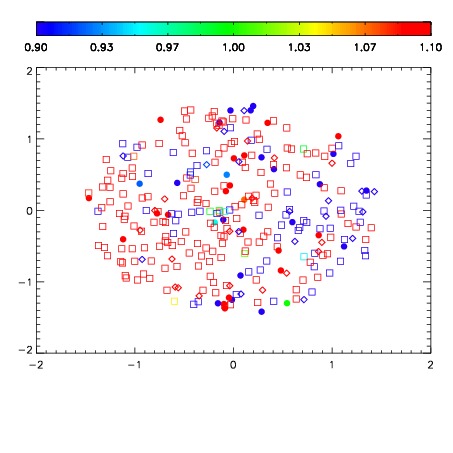
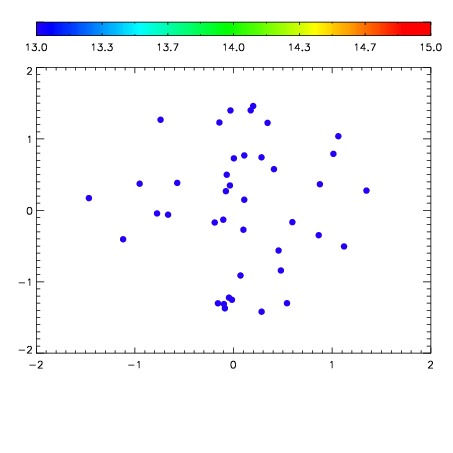

| Frame | Nreads | Zeropoints | Mag plots | Spatial mag deviation | Spatial sky 16325A emission deviations (filled: sky, open: star) | Spatial sky continuum emission | Spatial sky telluric CO2 absorption deviations (filled: H < 10) | |||||||||||||||||||||||
| 0 | 0 |
|
|
|
|
|
|
| IPAIR | NAME | SHIFT | NEWSHIFT | S/N | NAME | SHIFT | NEWSHIFT | S/N |
| 0 | 02790049 | 0.434098 | 0.00000 | 148.087 | 02790050 | 0.00406082 | 0.430037 | 157.741 |
| 1 | 02790057 | 0.425992 | 0.00810599 | 195.444 | 02790058 | 0.00240556 | 0.431692 | 188.220 |
| 2 | 02790056 | 0.423844 | 0.0102540 | 175.925 | 02790047 | 0.00000 | 0.434098 | 171.852 |
| 3 | 02790052 | 0.423347 | 0.0107510 | 162.239 | 02790054 | 0.00392018 | 0.430178 | 166.967 |
| 4 | 02790048 | 0.423972 | 0.0101260 | 158.273 | 02790055 | -0.000853912 | 0.434952 | 166.603 |
| 5 | 02790053 | 0.427973 | 0.00612500 | 157.027 | 02790051 | -0.00214532 | 0.436243 | 164.919 |