| Frame | Nreads | Zeropoints | Mag plots
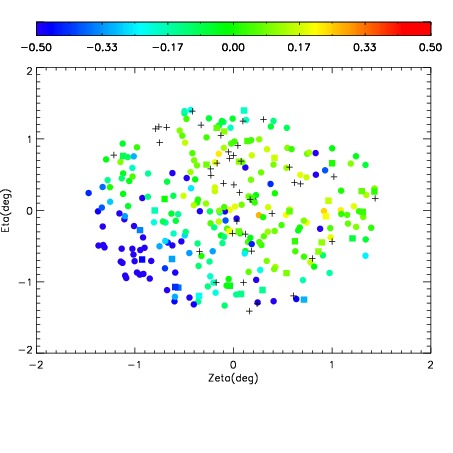
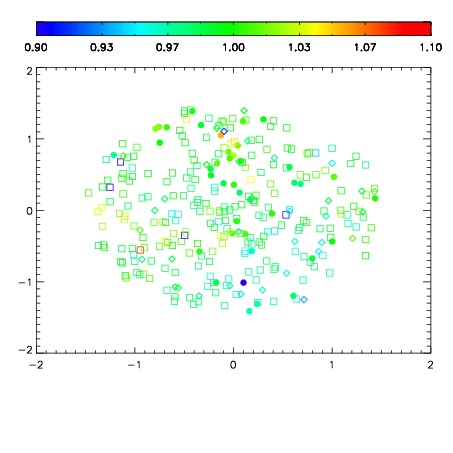
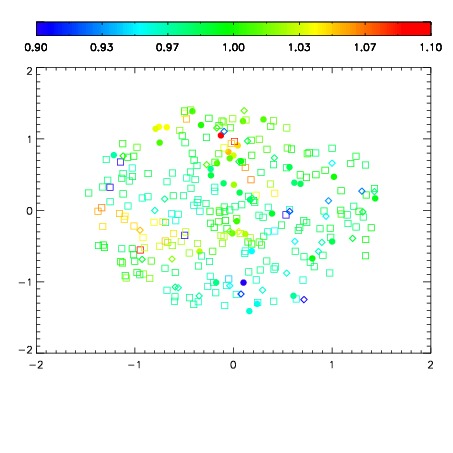
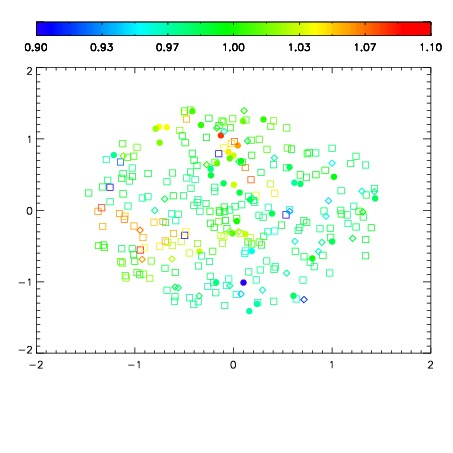
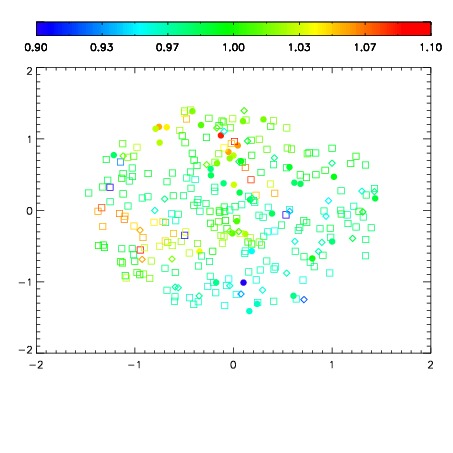
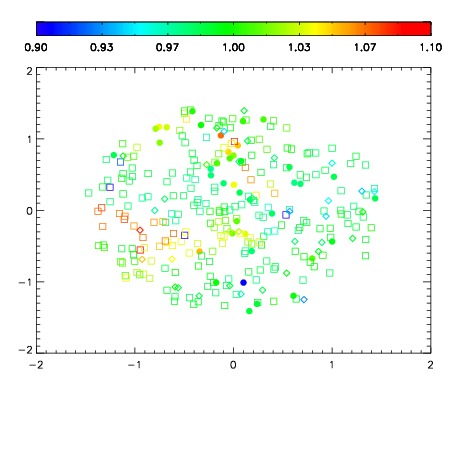
| Spatial mag deviation
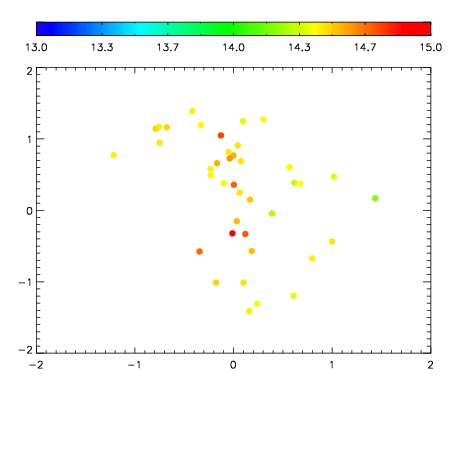
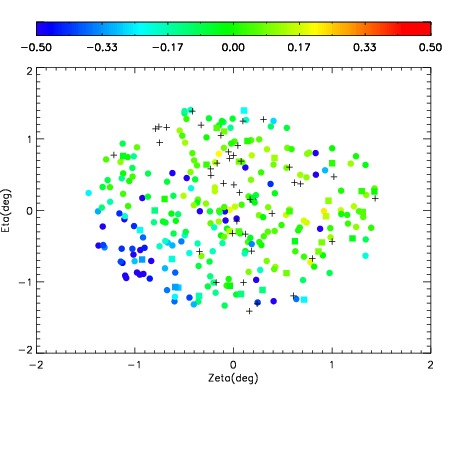
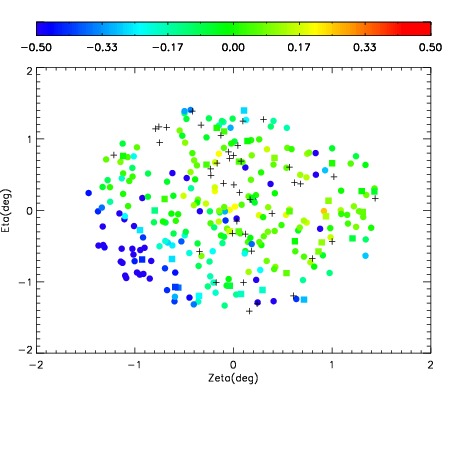
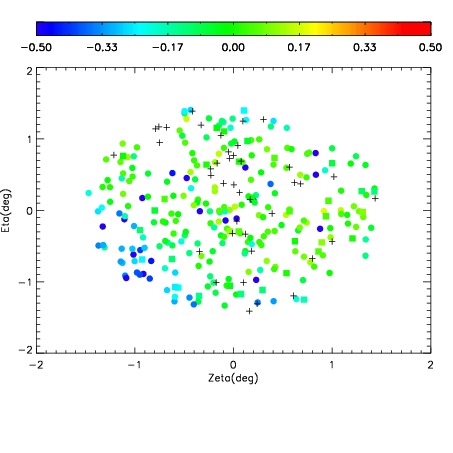
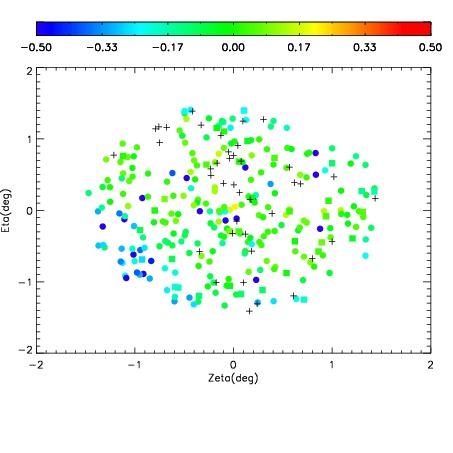
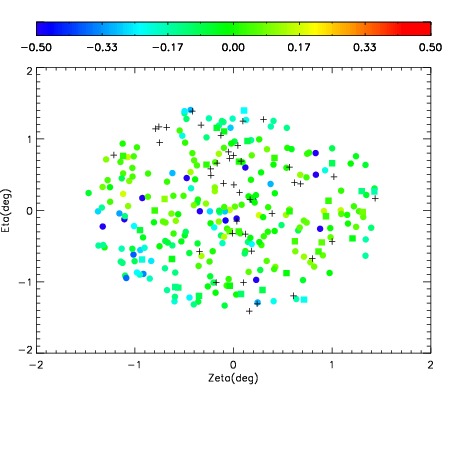
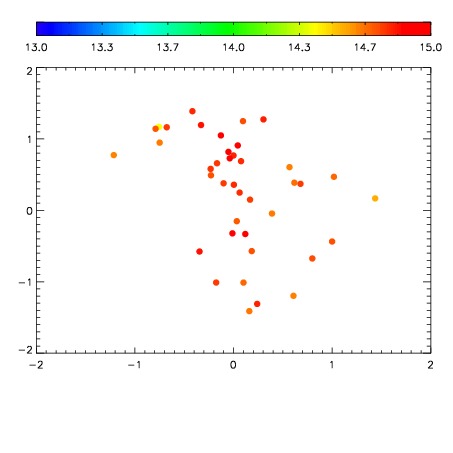
| Spatial sky 16325A emission deviations (filled: sky, open: star)
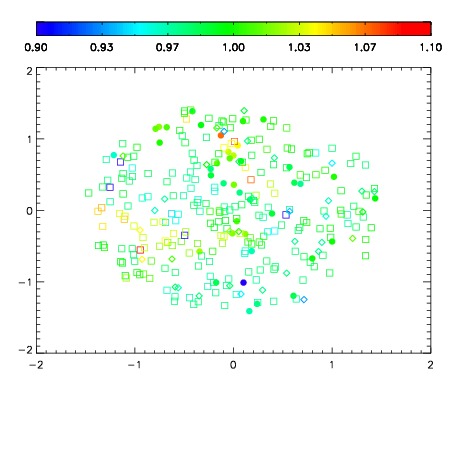
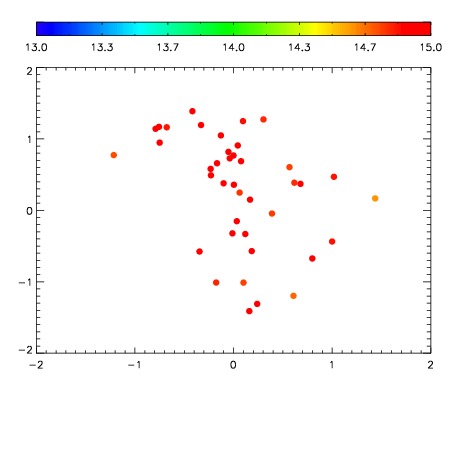
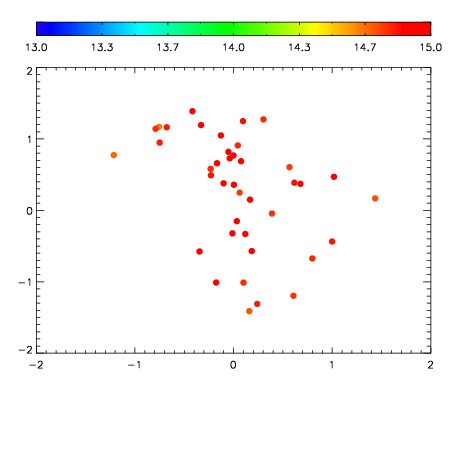
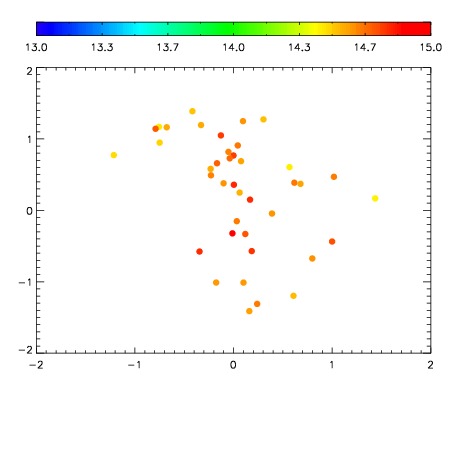
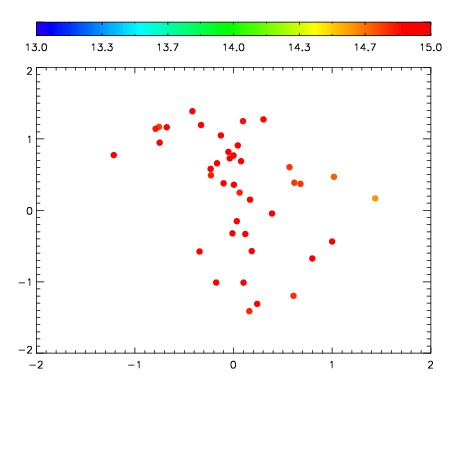
| Spatial sky continuum emission
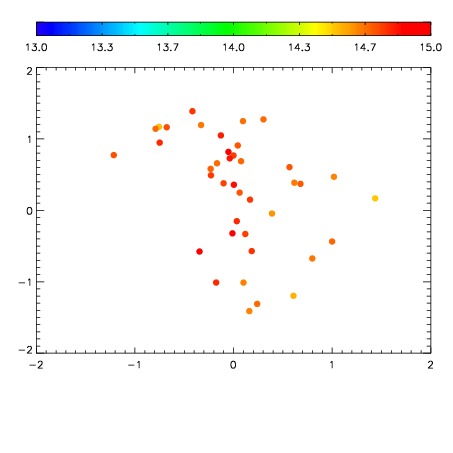
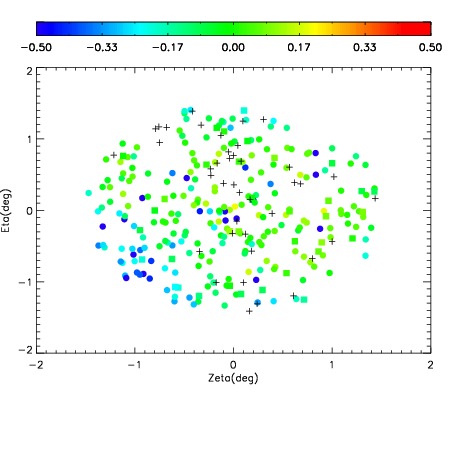
| Spatial sky telluric CO2 absorption deviations (filled: H < 10)
|
| 2540048
| 47
| | Red | Green | Blue
| | z | | 18.71
| | znorm | | 14.53
| | sky | 14.6 | 14.4 | 14.4
| | S/N | 10.5 | 19.1 | 19.0
| | S/N(c) | 9.1 | 17.5 | 17.3
| | SN(E/C) 0.89
|
| 
| 
| 
| 
| 
|
| 2540049
| 47
| | Red | Green | Blue
| | z | | 18.60
| | znorm | | 14.42
| | sky | 14.8 | 14.7 | 14.9
| | S/N | 9.3 | 17.5 | 17.9
| | S/N(c) | 8.0 | 15.9 | 16.2
| | SN(E/C) 0.86
|
| 
| 
| 
| 
| 
|
| 2540050
| 47
| | Red | Green | Blue
| | z | | 18.61
| | znorm | | 14.43
| | sky | 14.9 | 14.8 | 14.9
| | S/N | 10.0 | 18.1 | 18.3
| | S/N(c) | 8.7 | 16.6 | 16.7
| | SN(E/C) 0.93
|
| 
| 
| 
| 
| 
|
| 2540051
| 47
| | Red | Green | Blue
| | z | | 18.86
| | znorm | | 14.67
| | sky | 14.8 | 14.9 | 15.0
| | S/N | 11.0 | 20.3 | 21.2
| | S/N(c) | 9.6 | 18.5 | 19.5
| | SN(E/C) 0.89
|
| 
| 
| 
| 
| 
|
| 2540052
| 47
| | Red | Green | Blue
| | z | | 18.27
| | znorm | | 14.09
| | sky | 14.9 | 14.8 | 15.0
| | S/N | 7.4 | 14.7 | 14.5
| | S/N(c) | 6.3 | 13.5 | 13.1
| | SN(E/C) 0.89
|
| 
| 
| 
| 
| 
|
| 2540053
| 47
| | Red | Green | Blue
| | z | | 18.48
| | znorm | | 14.30
| | sky | 14.7 | 14.6 | 14.8
| | S/N | 8.9 | 16.6 | 16.4
| | S/N(c) | 7.7 | 15.2 | 14.9
| | SN(E/C) 0.82
|
| 
| 
| 
| 
| 
|
| 2540054
| 47
| | Red | Green | Blue
| | z | | 18.51
| | znorm | | 14.33
| | sky | 14.9 | 14.9 | 15.0
| | S/N | 8.8 | 16.3 | 16.4
| | S/N(c) | 7.6 | 14.8 | 14.9
| | SN(E/C) 0.89
|
| 
| 
| 
| 
| 
|
| 2540055
| 47
| | Red | Green | Blue
| | z | | 18.39
| | znorm | | 14.21
| | sky | 14.7 | 14.8 | 15.2
| | S/N | 8.0 | 15.8 | 15.7
| | S/N(c) | 7.1 | 14.4 | 14.4
| | SN(E/C) 0.89
|
| 
| 
| 
| 
| 
|